Stryker (SYK) Dividend Stock Analysis
I really want to get more exposure to the healthcare industry as I currently only have Medtronic in my FI Portfolio. Late last month I looked at Baxter International (BAX) and really liked what I saw, but unfortunately I had no free capital so I couldn't purchase. I'm still hopeful that I'll get an opportunity later this month or sometime next month to pick up some shares. I also received a request to look at Stryker Corporation (SYK), so that's who we'll look at today. Stryker was trading around $71.28 per share on Monday, September 23rd, giving a current yield of 1.49%.
Company Background (sourced from Yahoo! Finance):
Stryker Corporation, a medical technology company, provides reconstructive, medical and surgical, and neurotechnology and spine products for doctors, hospitals, and other healthcare facilities. Its Reconstructive segment offers orthopaedic reconstructive implants used in hip and knee joint replacements; and trauma implant systems, as well as other related products. The company’s MedSurg segment provides surgical equipment and surgical navigation systems, endoscopic and communications systems, patient handling and emergency medical equipment, and reprocessed and remanufactured medical devices, as well as other medical device products for use in various medical specialties. Stryker Corporation’s Neurotechnology and Spine segment offers neurosurgical and neurovascular devices, which include products for use in endovascular techniques, products for use in traditional brain and open skull base surgical procedures, and orthobiologic and biosurgery products, as well as products for the treatment of acute ischemic and hemorrhagic stroke. This segment also develops, manufactures, and markets spinal implant products, such as cervical, thoracolumbar, and interbody systems for use in spinal injury, deformity, and degenerative therapies. The company sells its products through direct sales, and third-party dealers and distributors in the United States and approximately 100 countries worldwide.
DCF Valuation:
Analysts expect Stryker to grow earnings 10.59% per year for the next five years and I've assumed they can grow at 2/3 of that, or 7.06%, for the next 3 years and continue to grow at 3.50% per year thereafter. Running these numbers through a three stage DCF analysis with a 10% discount rate yields a fair value price of $152.00. This means the shares are trading at a 53.1% discount to the discounted cash flow analysis.
Graham Number:
The Graham Number valuation method was conceived of by Benjamin Graham, the father of value investing, and calculates the maximum price one should pay for a company given the earnings and book value. Stryker earned $2.98 per share in the last twelve months and has a current book value of $22.75. The Graham Number is calculated to be $39.06, suggesting that Stryker is overvalued by 82.5%.
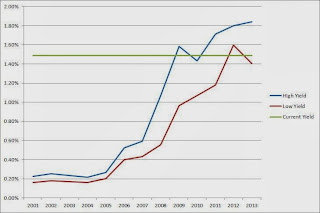
Average High Dividend Yield:
Stryker's average high dividend yield for the past 5 years is 1.67% and for the past 10 years is 1.10%. This gives target prices of $63.31 and $96.02 respectively based on the current annual dividend of $1.06. I'm more inclined to think the 5 year average is more realistic over the next few years as the 10 year average is brought down from early in the period. So I'll use the 5 year average for my target entry price calculation. Stryker is trading at a 12.6% premium to his price.
Average Low PE Ratio:
Stryker's average low PE ratio for the past 5 years is 13.12 and for the past 10 years is 18.59. This corresponds to a price per share of $55.48 and $78.63 respectively based off the analyst estimate of $4.23 per share for fiscal year 2013. The 10 year low PE ratio seems high to project going forward as Stryker was growing so much in the early part of the decade that its' shares were commanding a much higher payout ratio. However, since FY 2008 it's typical PE ratios have come down. So I'll use the 5 year average in my target entry price calculation. Stryker is trading at a 28.5% premium, suggesting that it's overvalued.
Average Low P/S Ratio:
Stryker's average low PS ratio for the past 5 years is 2.15 and for the past 10 years is 2.73. This corresponds to a price per share of $53.22 and $67.75 respectively based off the analyst estimate for revenue growth from FY 2012 to FY 2013. The price targets don't include effects due to potential share buybacks, rather it's just based off the analyst estimate for revenue and growth to be a bit conservative. Currently, their current PS ratio is 3.07 on a trailing twelve months basis. Much like the high dividend yield and low PE ratios from above, Stryker was trading for a premium in the first part of the decade leading to a higher low PS ratio on the 10 year basis. Once again I'll use the 5 year average in my target entry price calculation, giving a price of $53.22. Stryker is currently trading for a 33.9% premium to this price.
Dividend Discount Model:
For the DDM, I assumed that Stryker will be able to grow dividends for the next 5 years at the lowest of the 1, 3, 5 or 10 year growth rates or 15%. In this case that would be 15.00%. After that I assumed they can continue to raise dividends for 3 years at 75% of 15.00%, or 11.25%, and in perpetuity at 3.50%. The dividend growth rates are based off fiscal year payouts and don't necessarily correspond to quarter over quarter increases. To calculate the value I used a discount rate of 10%. Based on the DDM, Stryker is worth $30.25, meaning it's overvalued by 135.7%. If you run through the calculations with just using the lowest of the growth rates, the DDM price is $39.80.
PE Ratios:
Stryker's trailing PE is 23.95 and it's forward PE is 15.41. The PE3 based on the average earnings for the last 3 years is 21.32. I like to see the PE3 be less than 15 which Stryker is currently well over. Compared to it's industry, SYK seems to be overvalued versus ZMH (20.63) but undervalued versus the industry as a whole (25.26). All comparisons are on a TTM basis. Stryker's PEG for the next 5 years is currently at 2.07 which has SYK overvalued versus ZMH (1.59) and the industry overall (1.57). A lower PEG ratio is better because it means you're paying less for every dollar of growth the company achieves.
Fundamentals:
Stryker's gross margins for FY 2011 and FY 2012 were 70.5% and 69.7% respectively. They have averaged a 58.5% gross profit margin over the last 10 years. Their net income margin for the same years were 16.2% and 15.0%. Since 2003 their net income margin has averaged 12.9% with a low of 8.5% in FY 2003. I typically like to see gross margins greater than 60% and at least higher than 40% with net income margins being 10% and at least 7%. Both their gross and net income margins are well above the respective thresholds. Since each industry is different and allows for different margins, I feel it's prudent to compare SYK to its industry. For FY 2012, Stryker captured 99.4% of the gross margin for the industry and 157.9% of the net income margin. On the gross margin front their tracking with the industry, but when it comes to the bottom line of the income statement, Stryker is doing better by over 55%. They've consistently been above the industry average so clearly management is doing something right when it comes to turning revenue into net income.
Share Buyback:
Stryker hasn't really committed to repurchasing shares, which is fine by me especially since shares seem to have been quite expensive prior to FY 2008. Since FY 2003, they've have a net buyback of 5.9% of their outstanding shares for a 0.67% annualized rate. Nothing to write home about but at least the count is slowly decreasing. I'd rather management focus on making accretive acquisitions to grow the company and expand their core lines than worry about share repurchases. When we examine the cash flow statement later, it appears as though management has been fairly prudent with their share buybacks as they have increased since FY 2008 when shares started trading at more reasonable valuations.

A negative number for the % change value means shares were bought back by the company and a positive value means the shares outstanding increased.
Dividend Analysis:
Stryker is a dividend contender with 20 consecutive years of dividend increases. That's quite an impressive streak for any company. Before looking more into the company I was thinking the streak was in the 7-10 year range, but they passed that long ago. They have increased the dividend at a 20.00%, 21.64%, 22.22%, and 31.10% rate over the last 1, 3, 5, and 10 year periods respectively. Dividend increases are based off fiscal year payouts and don't necessarily correspond to annual payouts. Their payout ratio based off EPS has averaged 14.7% over the last 10 years and was 26.6% in FY 2012. Their payout ratio has been increasing over time which has allowed them to grow their dividend faster than EPS. Eventually that will have to come to an end, but there's still plenty of room for them to continue increasing the dividend without sacrificing growth of the company and analysts do expect earnings to grow over 10% per year for the next 5 years. The dividend growth potential is there and is honestly quite intriguing.

Stryker has done a great job managing their cash flow and have been able to turn 87.9% of their operating cash flow into free cash flow over the last 5 years and 70.1% into FCF after dividends over the last 5 years. They've been able to increase their efficiency as the respective 10 year averages are 80.9% and 70.3%. The FCF after dividends has been fairly steady despite the dividend growing significantly over the last 10 years which is a great sign. Their free cash flow has grown from $0.504B in 2003 to $1.447B in 2012, good for a 12.4% annualized increase while their free cash flow after dividends has grown from $0.480B to $1.123B over the same time for a 9.9% annual increase. The free cash flow payout ratio has averaged 15.0% over the last 10 years and was 23.8% in FY 20012. As the dividend has been increasing faster than overall growth of the company, the FCF payout ratio has been expanding. If the analyst estimates for growth turn out then there should still be plenty of core growth of the dividend without expansion of the payout ratios.


Return on Equity and Return on Capital Invested:
Stryker's ROE has averaged a solid 17.7% over the last 5 years and 18.5% over the last 10 years. Stryker's ROCI has averaged 16.1% over the last 5 years and 17.5% over the last 10 years. That's some fairly consistent long-term returns. I don't necessarily look for any absolute values for ROE or ROCI but rather fairly stable or increasing levels. Stryker has had fairly consistent returns on both equity and invested capital but both figures have been trending down. I'd like to see that trend reverse with the conclusion of this fiscal year, but both ratios are still at great levels. Their overall debt level has increased since the early 2003 but isn't anything to really be concerned about at this time as their total debt-to-equity ratio has averaged 0.07 over the last 10 years, but was at 0.20 for FY 2012. Their balance sheet is very clean and there's no worries here unless management decides they need to take on more debt, which I don't expect that to happen at any significant levels.

Revenue and Net Income:
Since the basis of dividend growth is revenue and net income growth, we'll now look at how Stryker has done on that front. Their revenue growth since 2003 has been excellent with a 10.2% annual increase while their net income growth has been even better at 12.4% per year. This has led to their net profit margin increasing over that time from 12.5% to 15.0% over the last 10 years. Even better is that revenue has increased every year since 2003 and net income has only had 2 years of declines (FY 2009 and FY 2012), although the declines weren't bad being around 3.5%.

Forecast:

The chart shows the historical high and low prices since 2003 and the forecast based on the average PE ratios and the expected EPS values. I have also included a forecast based off a PE ratio that is only 75% of the average low PE ratio. I like to the look to buy at the 75% Low PE price or lower to provide for a larger margin of safety, although this price doesn't usually come around very often. In the case of Stryker, the target low PE is 15.85 and the 0.75 * PE is 11.89. This corresponds to an entry price of $67.02 based off the expected earnings for FY 2013 of $4.23, with a 75% target price of $41.61. Currently Stryker is trading at a $29.67 premium to the 75% low PE target price and a $4.22 premium to the average low PE price.
Conclusion:
The average of all the valuation models gives a target entry price of $65.55 which means that Stryker is currently trading at a 8.7% premium to the target entry price. I've also calculated it with the highest and lowest valuation methods thrown out. In this case, the DCF and DDM valuations are removed and the new average is $52.77. Stryker is trading at a 35.1% premium to this price as well.
Assuming that Stryker can grow their earnings and dividends at the rates that I assumed, you're still looking at solid returns over the next 10 years. In 2023, EPS would be $9.19 and slapping an average PE of 15.48 gives a price of $142.31. Over the next 10 years you'd also receive $22.35 in dividends for a total return of 231.01% which is good for a 8.73% annualized rate if you purchase at the current price. If you purchase at my target entry price of $52.77, your projected 10 year total return jumps to 312.04% for an annualized return of 12.05%.
According to Yahoo! Finance the 1 year target estimate is at $73.95 suggesting about 3.75% upside from Monday's trading. Morningstar has Stryker rated as a 3 star stock meaning suggesting that it's trading on par with their fair value estimate.

As mentioned at the end of my analysis on Baxter International, the demographics are something you can't really fight when it comes to healthcare. The population in the United States as well as globally is living longer and growing older on the whole. It's not something that's fun to think about, but older people generally have more medical issues as their bodies begin to breakdown. Stryker has exposure to 2 big segments in their neurotechnology segment (strokes) and orthopaedic segment (hip and knee-joint replacements). Those are two fairly common medical issues among the elderly, and my grandmother just recently had both knees replaced. The full implementation of the Affordable Care Act is going to effect all companies related to the healthcare industry but I think Stryker won't be effected all that negatively because their products are necessities and the demographics alone can overcome the extra tax on medical device makers.
Management is clearly committed to the dividend as they've increased it year in and year out for 20 years. I wouldn't expect to see them cease increasing it unless the company was in absolutely dire emergency. While the dividends have grown faster than earnings over the last 10 years, they still are comfortably covered by earnings and cash flow. If the analysts estimates for growth due pan out then you could see core growth of the dividend over 10% without expanding their payout ratios. Given the ample coverage I expect to see their payout ratios continue to slightly increase, meaning that the dividend should still growth well into the teen's percentage wise. The biggest drawback with Stryker as an investment is that the current yield is very low at only 1.50%. Even at the best valuation levels you only could have gotten around a 1.85% yield at purchase. Much like Visa and Starbucks, the dividend growth will have to fuel the the dividend returns because the yield is just too low.
I would say that Stryker seems a little overvalued currently, but it's within range of the average fair valuation. You aren't getting bargain basement prices currently, unless the growth turns out to be even higher than estimated. Which is possible given the demographic trends leading right into Stryker's wheelhouse. Although I wouldn't purchase on the hopes that growth will turn out better than expected, only for it to be in line or come in lower and then be disappointed. It's much better to be conservative in the growth estimates and be surprised to the upside. If Stryker's share price pulls back to the the upper $60's I'd be interested in possibly starting a position, but in reality I'd lean more towards selling puts. A cursory look the January 2014 puts looks like there could be some decent returns whether they're executed or expire worthless.
To check out more reports check out my Stock Analysis page.
What do you think about Stryker Corporation. as a DG investment? How do you think the long-term dividend growth prospects are?
Company Background (sourced from Yahoo! Finance):
Stryker Corporation, a medical technology company, provides reconstructive, medical and surgical, and neurotechnology and spine products for doctors, hospitals, and other healthcare facilities. Its Reconstructive segment offers orthopaedic reconstructive implants used in hip and knee joint replacements; and trauma implant systems, as well as other related products. The company’s MedSurg segment provides surgical equipment and surgical navigation systems, endoscopic and communications systems, patient handling and emergency medical equipment, and reprocessed and remanufactured medical devices, as well as other medical device products for use in various medical specialties. Stryker Corporation’s Neurotechnology and Spine segment offers neurosurgical and neurovascular devices, which include products for use in endovascular techniques, products for use in traditional brain and open skull base surgical procedures, and orthobiologic and biosurgery products, as well as products for the treatment of acute ischemic and hemorrhagic stroke. This segment also develops, manufactures, and markets spinal implant products, such as cervical, thoracolumbar, and interbody systems for use in spinal injury, deformity, and degenerative therapies. The company sells its products through direct sales, and third-party dealers and distributors in the United States and approximately 100 countries worldwide.
DCF Valuation:
Analysts expect Stryker to grow earnings 10.59% per year for the next five years and I've assumed they can grow at 2/3 of that, or 7.06%, for the next 3 years and continue to grow at 3.50% per year thereafter. Running these numbers through a three stage DCF analysis with a 10% discount rate yields a fair value price of $152.00. This means the shares are trading at a 53.1% discount to the discounted cash flow analysis.
Graham Number:
The Graham Number valuation method was conceived of by Benjamin Graham, the father of value investing, and calculates the maximum price one should pay for a company given the earnings and book value. Stryker earned $2.98 per share in the last twelve months and has a current book value of $22.75. The Graham Number is calculated to be $39.06, suggesting that Stryker is overvalued by 82.5%.
Average High Dividend Yield:
Stryker's average high dividend yield for the past 5 years is 1.67% and for the past 10 years is 1.10%. This gives target prices of $63.31 and $96.02 respectively based on the current annual dividend of $1.06. I'm more inclined to think the 5 year average is more realistic over the next few years as the 10 year average is brought down from early in the period. So I'll use the 5 year average for my target entry price calculation. Stryker is trading at a 12.6% premium to his price.

Stryker's average low PE ratio for the past 5 years is 13.12 and for the past 10 years is 18.59. This corresponds to a price per share of $55.48 and $78.63 respectively based off the analyst estimate of $4.23 per share for fiscal year 2013. The 10 year low PE ratio seems high to project going forward as Stryker was growing so much in the early part of the decade that its' shares were commanding a much higher payout ratio. However, since FY 2008 it's typical PE ratios have come down. So I'll use the 5 year average in my target entry price calculation. Stryker is trading at a 28.5% premium, suggesting that it's overvalued.
Average Low P/S Ratio:
Stryker's average low PS ratio for the past 5 years is 2.15 and for the past 10 years is 2.73. This corresponds to a price per share of $53.22 and $67.75 respectively based off the analyst estimate for revenue growth from FY 2012 to FY 2013. The price targets don't include effects due to potential share buybacks, rather it's just based off the analyst estimate for revenue and growth to be a bit conservative. Currently, their current PS ratio is 3.07 on a trailing twelve months basis. Much like the high dividend yield and low PE ratios from above, Stryker was trading for a premium in the first part of the decade leading to a higher low PS ratio on the 10 year basis. Once again I'll use the 5 year average in my target entry price calculation, giving a price of $53.22. Stryker is currently trading for a 33.9% premium to this price.
Dividend Discount Model:
For the DDM, I assumed that Stryker will be able to grow dividends for the next 5 years at the lowest of the 1, 3, 5 or 10 year growth rates or 15%. In this case that would be 15.00%. After that I assumed they can continue to raise dividends for 3 years at 75% of 15.00%, or 11.25%, and in perpetuity at 3.50%. The dividend growth rates are based off fiscal year payouts and don't necessarily correspond to quarter over quarter increases. To calculate the value I used a discount rate of 10%. Based on the DDM, Stryker is worth $30.25, meaning it's overvalued by 135.7%. If you run through the calculations with just using the lowest of the growth rates, the DDM price is $39.80.
PE Ratios:
Stryker's trailing PE is 23.95 and it's forward PE is 15.41. The PE3 based on the average earnings for the last 3 years is 21.32. I like to see the PE3 be less than 15 which Stryker is currently well over. Compared to it's industry, SYK seems to be overvalued versus ZMH (20.63) but undervalued versus the industry as a whole (25.26). All comparisons are on a TTM basis. Stryker's PEG for the next 5 years is currently at 2.07 which has SYK overvalued versus ZMH (1.59) and the industry overall (1.57). A lower PEG ratio is better because it means you're paying less for every dollar of growth the company achieves.
Fundamentals:
Stryker's gross margins for FY 2011 and FY 2012 were 70.5% and 69.7% respectively. They have averaged a 58.5% gross profit margin over the last 10 years. Their net income margin for the same years were 16.2% and 15.0%. Since 2003 their net income margin has averaged 12.9% with a low of 8.5% in FY 2003. I typically like to see gross margins greater than 60% and at least higher than 40% with net income margins being 10% and at least 7%. Both their gross and net income margins are well above the respective thresholds. Since each industry is different and allows for different margins, I feel it's prudent to compare SYK to its industry. For FY 2012, Stryker captured 99.4% of the gross margin for the industry and 157.9% of the net income margin. On the gross margin front their tracking with the industry, but when it comes to the bottom line of the income statement, Stryker is doing better by over 55%. They've consistently been above the industry average so clearly management is doing something right when it comes to turning revenue into net income.
Share Buyback:
Stryker hasn't really committed to repurchasing shares, which is fine by me especially since shares seem to have been quite expensive prior to FY 2008. Since FY 2003, they've have a net buyback of 5.9% of their outstanding shares for a 0.67% annualized rate. Nothing to write home about but at least the count is slowly decreasing. I'd rather management focus on making accretive acquisitions to grow the company and expand their core lines than worry about share repurchases. When we examine the cash flow statement later, it appears as though management has been fairly prudent with their share buybacks as they have increased since FY 2008 when shares started trading at more reasonable valuations.

A negative number for the % change value means shares were bought back by the company and a positive value means the shares outstanding increased.
Dividend Analysis:
Stryker is a dividend contender with 20 consecutive years of dividend increases. That's quite an impressive streak for any company. Before looking more into the company I was thinking the streak was in the 7-10 year range, but they passed that long ago. They have increased the dividend at a 20.00%, 21.64%, 22.22%, and 31.10% rate over the last 1, 3, 5, and 10 year periods respectively. Dividend increases are based off fiscal year payouts and don't necessarily correspond to annual payouts. Their payout ratio based off EPS has averaged 14.7% over the last 10 years and was 26.6% in FY 2012. Their payout ratio has been increasing over time which has allowed them to grow their dividend faster than EPS. Eventually that will have to come to an end, but there's still plenty of room for them to continue increasing the dividend without sacrificing growth of the company and analysts do expect earnings to grow over 10% per year for the next 5 years. The dividend growth potential is there and is honestly quite intriguing.

Stryker has done a great job managing their cash flow and have been able to turn 87.9% of their operating cash flow into free cash flow over the last 5 years and 70.1% into FCF after dividends over the last 5 years. They've been able to increase their efficiency as the respective 10 year averages are 80.9% and 70.3%. The FCF after dividends has been fairly steady despite the dividend growing significantly over the last 10 years which is a great sign. Their free cash flow has grown from $0.504B in 2003 to $1.447B in 2012, good for a 12.4% annualized increase while their free cash flow after dividends has grown from $0.480B to $1.123B over the same time for a 9.9% annual increase. The free cash flow payout ratio has averaged 15.0% over the last 10 years and was 23.8% in FY 20012. As the dividend has been increasing faster than overall growth of the company, the FCF payout ratio has been expanding. If the analyst estimates for growth turn out then there should still be plenty of core growth of the dividend without expansion of the payout ratios.


Return on Equity and Return on Capital Invested:
Stryker's ROE has averaged a solid 17.7% over the last 5 years and 18.5% over the last 10 years. Stryker's ROCI has averaged 16.1% over the last 5 years and 17.5% over the last 10 years. That's some fairly consistent long-term returns. I don't necessarily look for any absolute values for ROE or ROCI but rather fairly stable or increasing levels. Stryker has had fairly consistent returns on both equity and invested capital but both figures have been trending down. I'd like to see that trend reverse with the conclusion of this fiscal year, but both ratios are still at great levels. Their overall debt level has increased since the early 2003 but isn't anything to really be concerned about at this time as their total debt-to-equity ratio has averaged 0.07 over the last 10 years, but was at 0.20 for FY 2012. Their balance sheet is very clean and there's no worries here unless management decides they need to take on more debt, which I don't expect that to happen at any significant levels.

Revenue and Net Income:
Since the basis of dividend growth is revenue and net income growth, we'll now look at how Stryker has done on that front. Their revenue growth since 2003 has been excellent with a 10.2% annual increase while their net income growth has been even better at 12.4% per year. This has led to their net profit margin increasing over that time from 12.5% to 15.0% over the last 10 years. Even better is that revenue has increased every year since 2003 and net income has only had 2 years of declines (FY 2009 and FY 2012), although the declines weren't bad being around 3.5%.

Forecast:

Conclusion:
The average of all the valuation models gives a target entry price of $65.55 which means that Stryker is currently trading at a 8.7% premium to the target entry price. I've also calculated it with the highest and lowest valuation methods thrown out. In this case, the DCF and DDM valuations are removed and the new average is $52.77. Stryker is trading at a 35.1% premium to this price as well.
Assuming that Stryker can grow their earnings and dividends at the rates that I assumed, you're still looking at solid returns over the next 10 years. In 2023, EPS would be $9.19 and slapping an average PE of 15.48 gives a price of $142.31. Over the next 10 years you'd also receive $22.35 in dividends for a total return of 231.01% which is good for a 8.73% annualized rate if you purchase at the current price. If you purchase at my target entry price of $52.77, your projected 10 year total return jumps to 312.04% for an annualized return of 12.05%.
According to Yahoo! Finance the 1 year target estimate is at $73.95 suggesting about 3.75% upside from Monday's trading. Morningstar has Stryker rated as a 3 star stock meaning suggesting that it's trading on par with their fair value estimate.

As mentioned at the end of my analysis on Baxter International, the demographics are something you can't really fight when it comes to healthcare. The population in the United States as well as globally is living longer and growing older on the whole. It's not something that's fun to think about, but older people generally have more medical issues as their bodies begin to breakdown. Stryker has exposure to 2 big segments in their neurotechnology segment (strokes) and orthopaedic segment (hip and knee-joint replacements). Those are two fairly common medical issues among the elderly, and my grandmother just recently had both knees replaced. The full implementation of the Affordable Care Act is going to effect all companies related to the healthcare industry but I think Stryker won't be effected all that negatively because their products are necessities and the demographics alone can overcome the extra tax on medical device makers.
Management is clearly committed to the dividend as they've increased it year in and year out for 20 years. I wouldn't expect to see them cease increasing it unless the company was in absolutely dire emergency. While the dividends have grown faster than earnings over the last 10 years, they still are comfortably covered by earnings and cash flow. If the analysts estimates for growth due pan out then you could see core growth of the dividend over 10% without expanding their payout ratios. Given the ample coverage I expect to see their payout ratios continue to slightly increase, meaning that the dividend should still growth well into the teen's percentage wise. The biggest drawback with Stryker as an investment is that the current yield is very low at only 1.50%. Even at the best valuation levels you only could have gotten around a 1.85% yield at purchase. Much like Visa and Starbucks, the dividend growth will have to fuel the the dividend returns because the yield is just too low.
I would say that Stryker seems a little overvalued currently, but it's within range of the average fair valuation. You aren't getting bargain basement prices currently, unless the growth turns out to be even higher than estimated. Which is possible given the demographic trends leading right into Stryker's wheelhouse. Although I wouldn't purchase on the hopes that growth will turn out better than expected, only for it to be in line or come in lower and then be disappointed. It's much better to be conservative in the growth estimates and be surprised to the upside. If Stryker's share price pulls back to the the upper $60's I'd be interested in possibly starting a position, but in reality I'd lean more towards selling puts. A cursory look the January 2014 puts looks like there could be some decent returns whether they're executed or expire worthless.
To check out more reports check out my Stock Analysis page.
What do you think about Stryker Corporation. as a DG investment? How do you think the long-term dividend growth prospects are?
I didn't write about this but it crossed my mind as I was researching Stryker, and that was purchasing Mako Surgical. Sure enough, today it was announced that SYK would acquire MAKO for $1.4 B. This is around an 85% premium to MAKO's recent share price and SYK's management says there should be negative EPS effects the first year, neutral in year 2 and accretive in year 3. I think it might be a bit too much of a premium and considering how there won't be positive effects until year 3 that's a bit disappointing. I think MAKO's products are a good fit with SYK's existing lines and expertise. I'll be interested to see what SYK's management says about this purchase.
ReplyDeleteI would like to say this is an excellent site that I have ever come across. Very informative. Please write more so that we can get more details.
ReplyDeleteI have found your site to be quite useful. Keep updating your site with in valuable information... Regards
Surgery Sets