Dividend Growth Check-Up - 2019
Another year has rolled by and with 2019 officially in the books it's time to look back to see how dividend growth fared for my portfolio last year.
In this analysis I'll only be examining the positions and related dividend growth held within my main taxable account, FI Portfolio.
Forward Dividends by Sector
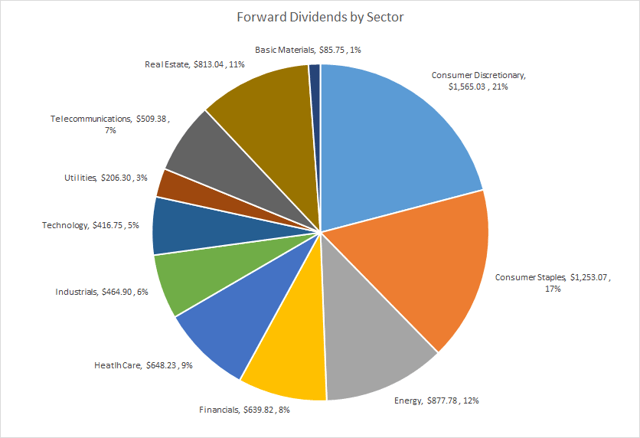
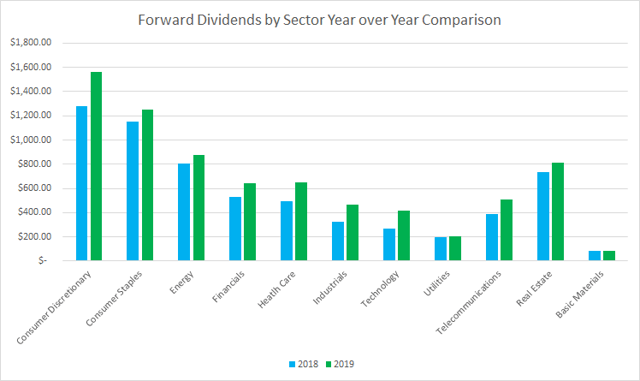
The forward dividends for my FI Portfolio ended 2019 at $7,480.04. The following chart breaks down my forward dividends by their primary sector.
The 2 largest sectors by dividends are focused on the consumer. Consumer discretionary accounts for 21% of my forward dividends with the staples making up 17%. I'd still like to increase my exposure to the staples; however, valuations as a whole don't really allow that at the time being.
Energy is the 3rd largest sector being forecast to provide 12% of my dividends in 2020. I'd still like to reduce my exposure there, mainly through deploying the dividends into other sectors rather than re-investing them as I did throughout much of 2019. Ideally I'd like to get the weighting down to 8-10%.
Looking at the rest of the sector weightings there's nothing that looks too out of whack. Real estate, specifically REITs, is my 4th largest sector and represents 11% of forward dividends which is about where I'd like it to be.
Utilities are the only sector that seems abnormally low for a dividend growth investor but that's largely been due to the markets. In general utilities have been bid up as the never-ending search for yield has pushed their valuations higher. As such I haven't added utilities to my portfolio and don't intend to do so until valuations become more attractive, whenever that may be.
All 11 sectors saw increases for 2019 compared to 2018. The largest increase came in the consumer discretionary sector with a 21% rise with consumer staples taking second place with an 18% increase.
Dividend Clubs
I like to look at my holdings by the amount of dividends that they provide so I created my "Dividend Clubs" based on varying levels of dividends that a position provides.
In order to join one of the Dividend Clubs the position needs to provide at least $50 in annual dividends, the next club up is the $100 level followed by the $200 and $300 level. The number of members includes all positions that have at least $50 in forward dividends while the unique members are those that are capped out in that level.
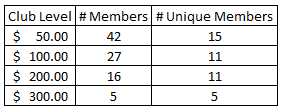
The $50 Club increased by 4 members compared to 2018 while losing 1 member that was capped out in the $50 level.
The $100 Club gained 5 total members pushing the number of positions that pay at least $100 in annual dividends up to 27.
The $200 Club gained 5 members as well compared to 2018 pushing the number of positions that pay at least $200 in annual dividends up to 16. The unique member count gained 2 members meaning that 2 positions that had previously paid less than $200 in dividends are now paying at least that much.
The $300 Club gained 3 compared to 2018 and now has 5 total members.
Unilever (UL) is on the precipice of joining the $50 Club and should do so in 2020. My Archer Daniels Midland (ADM), Bank of Nova Scotia (BNS) and Stabucks (SBUX) holdings should all move into the $100 Club with organic dividend growth alone.
If IBM (IBM) can deliver at least 2.1% dividend growth they will join the $200 Club. The other position that is likely to join that level is L3Harris Technologies (LHX) but needs to deliver ~9.3% dividend growth to do so.
Phillip Morris (PM) is the only holding that should join the $300 Club, but it's sister company Altria (MO) should move up to the $400 Club by the end of 2020.
Top 10 Holdings by Forward Dividends
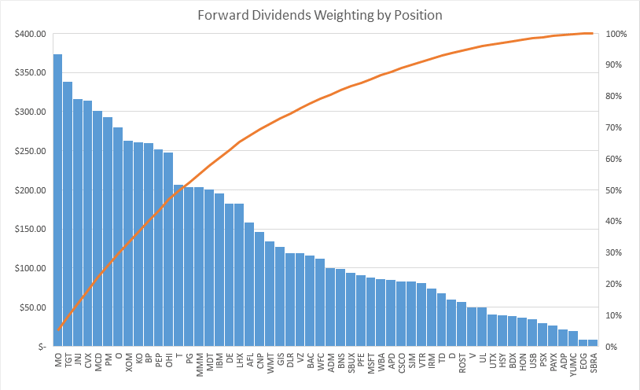
My forward dividends are still heavily weighted towards the Top 10 holdings with a number of smaller positions that I continue to try and build up. Given my perceived quality of the Top 10 holdings I'm comfortable with that much exposure although there's still plenty more companies that I'd like to see move higher on the list.
The Top 10 holdings account for 41.1% of my forward dividends which signifies pretty heavy weighting to those positions considering that represents just 18.5% of the total number of holdings that I own.
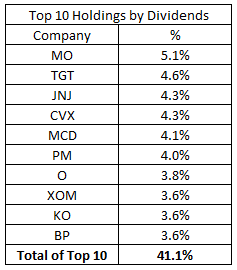
The Top 10 had a bit of a shakeup in 2019 with Altria taking over the pole position and replacing Omega Healthcare Investors (OHI) within the Top 10. Outside of that swap the Top 10 remain the same as 2018 just re-ordered due to some increases, and decreases, to position sizes as well as faster dividend growth from some of the holdings.
Dividend Growth
At the end of 2019 there were 54 companies held in my FI Portfolio. Unfortunately, 7 of those companies didn't announce raises during the year, but luckily 2019 didn't bring any dividend cuts.

The 7 names are BP (BP), Deere (DE), General Mills (GIS), Sabra (SBRA), United Technologies (UTX), Ventas (VTR) and YUM China (YUMC). Of the 7 stragglers I'm only a little surprised by 3 of them not announcing an increase.
The 3 surprise freezers were Deere, Ventas and YUM China. Deere's freeze was likely due to the double dose of increases announced in 2018 as well as the on-going trade war.
I didn't expect more than a token increase from Ventas like they gave in 2018, but they decided to not even do that which I'm not really upset about; however, it does mean that I should probably watch Ventas a bit closer.
The biggest surprise of all of them was YUM China. YUM China's TTM payout ratio sits at just 26% based on net income and 23% based on free cash flow. Using FY 2019 and FY 2020's estimates and the current annual payout of $0.48 the payout ratios are estimated at 27.0% and 24.9%. So the payout ratio isn't really a concern.
Sabra has yet to announce a raise since I got shares via the Care Capital Properties (CCP) merger which I had previously acquired shares from the spin-off from Ventas. The position is small at just 5 shares so there's not much at stake and the current yield of 8.5% is strong enough to just hold on for the ride. Although I am considering closing this position.
The struggles in the oil field since ~2015 has kept BP from announcing any significant increases to their dividend while they focus on cleaning up the balance sheet. The yield is high enough that I'll continue to hold my shares for the time being.
General Mills continues to go through some growing pains, or rather a lack of growing pains. Sales still haven't surpassed FY 2013's high water mark although they have shown top line growth each of the last 2 years. The TTM FCF payout ratio sits at just 49% so I'm hopeful that 2020 will see a return to dividend increases even if it's slow.
United Technologies was the last of the seven, but they were the least surprising to see the dividend kept level. For starters they were in the early stages of the merger with Raytheon (RTN) which is expected to finalize in the early part of 2020. Second of all, United Technologies has historically increased the dividend payment every 5th quarter.
Dividend Increases by Month
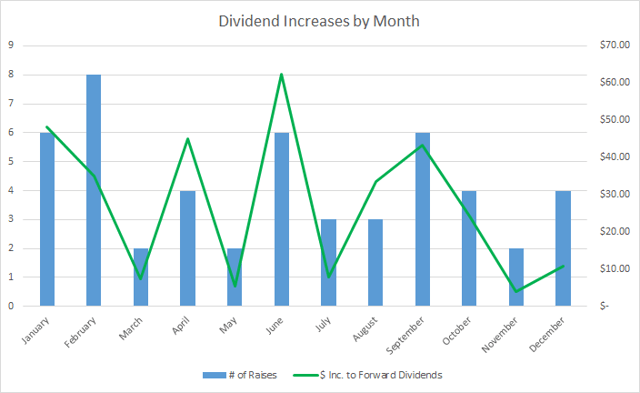
My entire FI Portfolio produced 50 total dividend increases throughout 2019 which isn't bad considering that 7 companies did not announce raises during the year.
February was the most active month for dividend increases among my FI Portfolio holdings. While June was the largest in dollar terms. Combined the 50 raises increased my forward dividends by $327.14.
Dividend Yield vs Dividend Growth Rate
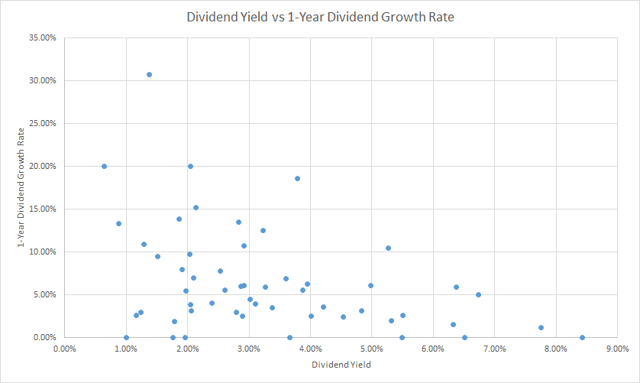
Dividend growth investing is all about finding balance namely in the current yield vs growth rate trade-off. I'd love to invest in a company paying a 5% yield that can achieve sustainable 15%+ dividend growth, but the reality is that doesn't happen.
I want the core of my investments in what I consider the "sweet spot" for dividend growth investing which is a current yield in the 2.5% - 4.5% range with 4-9% annual dividend growth rate. The rest is then comprised of the higher yielders and slower growers and of course the lower yielders with higher growth potential.
That trend generally held true in 2019. The large clustering of dots in and my sweet spot is good to see since it strikes a balance between current yield and future growth.
Portfolio Wide Dividend Growth
Among my FI Portfolio positions the average year over year growth rate came to 6.51% with a median increase of 5.23%. When looking at just the positions that had raises the average increases to 7.48% while the median increases to 5.88%.
I'm more interested in the weighted dividend growth rate as it gives a better picture of the organic dividend growth that my portfolio achieved.
Since each company carries a different weight in terms of dividends, the average growth rate doesn't mean a whole lot. Rather you have to assign a dividend weighting to each portfolio's dividend growth rate and sum it up.
The formula would look like this: 1-Year dividend growth for Position 1 * (Dividends for Position 1 / Total Dividends for Portfolio). Do that for each position, add them together and you get the weighted dividend growth for your portfolio.
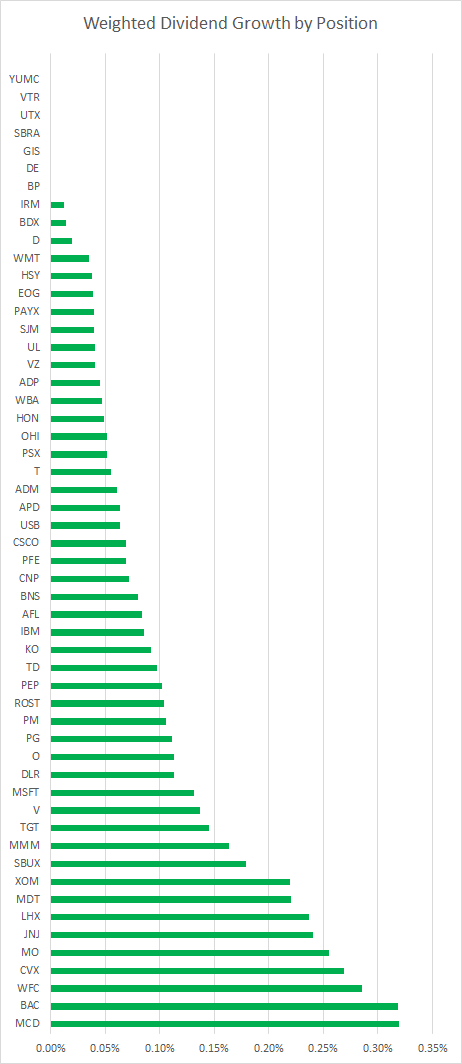
The weight dividend growth rate for my FI Portfolio for 2019 came to just 5.23%. That's a far cry from the 8.76% weighted growth rate in 2018.
While I was a bit disappointed with just a 5.23% growth rate, I can't complain too much considering that does include the 7 positions that announced no raises throughout the year. The other issue is that the high yielding, and slower growing companies, act as an anchor pulling down the weighted dividend growth rate.
Additionally, the positions that typically have high growth rates also carry low dividend yields and unless they are over-weight positions that accelerated dividend growth plays less of a role.
For example, my position in Visa (V) accounts for 3.2% of the dollar value for my portfolio, but just 0.7% of the dividends for my portfolio. Whereas AT&T (T) is just 1.5% of my portfolio value, but 2.9% of my dividends.
Focus For 2020
Overall, 2019 was a successful year. Dividend growth for my FI Portfolio was solid, but a bit lower than I'd have liked. Much of that has to do with companies pulling back on dividend growth after a banner 2018 once the corporate tax cuts went into effect. Of course the trade war and increasing calls for recession likely played a role in the muted dividend growth.
Looking at the bigger picture I'm happy with 2019's results despite the lower dividend growth. Each end of quarter month produced over $1,000 in dividends with September and December both crossing the $1,100 mark.
One of my goals for 2019 was to increase my weightings to the companies I already owned and to make the positions and their dividends more impactful. Too often I would initiate a position at what I felt was a good value only to see the share price rise. Subsequently, I wouldn't add because of my anchoring bias to the purchase price even if the shares still represented good value, just not as good.
I did a pretty good job of that throughout 2019, but not as good as I could have. So that will continue to be a goal of mine for 2020.
The two sectors that I'd like to increase my exposure to the most throughout 2020 would be health care and consumer staples. I'd also like to increase my utilities exposure, but I'm also going to remain committed to getting value for my investment dollars, especially since available capital is likely to be smaller than in 2019.
Do you calculate the weighted organic dividend growth rate for your portfolio? Did dividend growth come in higher or lower than you expected? What do you think your portfolio will produce in organic dividend growth over the long term?
Let me know in the comments below.

Lots of good stuff in this post, JC.
ReplyDeleteI'm surprised by the drop in your weighted dividend growth. I've yet to calculate mine for 2019, but I'm hoping I don't see the same decline. I had a few freezes as well, but not as many, so hopefully that should help me. I like the scatter chart showing the dividend yield vs. dividend growth for your holdings. It looks like you've got a good blend in your portfolio.
2019 was an amazing year for our portfolios, here's hoping we can add to it in 2020.
ED,
DeleteOverall dividend growth had declined compared to 2018 which benefited from the corporate tax cuts so I expected dividend growth to slow down in 2019. Couple that with the rising worries of recession and I wasn't too surprised. Of course, the big problem dragging the weighted growth rate down was the slow growth rates from my larger positions.
My Top 10 holdings by forward dividends had raises of 5%, 3.1%, 5.6%, 6.3%, 7.8%, 2.6%, 2.9%, 6.1%, 2.6% and 0%. So portfolio construction definitely played a big role in that. The 12 positions that had >10% year over year growth only account for 9.7% of my forward dividends. Of course they had much better capital appreciation overall compared to my Top 10 holdings.
It was another solid year, but I was a bit disappointed to see the weighted growth rate move down that much. I'd really like to see it up closer to between 6-7%.
Thanks for stopping by!