Chevron (CVX) Dividend Stock Analysis
I last wrote up a stock analysis on Chevron back in 2012. Really what happened to 2013? I've still updated the values on my stock analysis page, but I just didn't get a full updated write up out. Well, it's about time that I get an updated version out with the new year now on its' way. Chevron (CVX) trading around $120.02 on Wednesday, January 22nd and was offering a current yield of 3.33%.
Company Background (sourced from Yahoo! Finance):
Chevron Corporation, through its subsidiaries, engages in petroleum, chemicals, mining, power generation, and energy operations worldwide. The company operates in two segments, Upstream and Downstream. The Upstream segment is involved in the exploration, development, and production of crude oil and natural gas; liquefaction, transportation, and regasification associated with liquefied natural gas; transportation of crude oil through pipelines; and processing, transportation, storage, and marketing of natural gas, as well as holds interest in a gas-to-liquids project. The Downstream segment engages in refining crude oil into petroleum products; marketing crude oil and refined products; transporting crude oil and refined products through pipeline, marine vessel, motor equipment, and rail car; and manufacturing and marketing commodity petrochemicals and fuel and lubricant additives, as well as plastics for industrial uses. The company is also involved in coal and molybdenum mining operations; cash management and debt financing activities; insurance operations; real estate activities; and energy services, and alternative fuels and technology businesses, as well as manages interests in 11 power assets with a total operating capacity of approximately 2,200 megawatts. The company was formerly known as ChevronTexaco Corporation and changed its name to Chevron Corporation in 2005. Chevron Corporation was founded in 1879 and is headquartered in San Ramon, California.
DCF Valuation:
Analysts expect Chevron to grow earnings 6.87% per year for the next five years and I've assumed they can grow at 2/3 of that, or 4.58%, for the next 3 years and continue to grow at 4.00% per year thereafter. Running these numbers through a three stage DCF analysis with a 12% discount rate yields a fair value price of $160.36. This means the shares are trading at a 25.2% discount to the discounted cash flow analysis.
Graham Number:
The Graham Number valuation method was conceived of by Benjamin Graham, the father of value investing, and calculates the maximum price one should pay for a company given the earnings and book value. Chevron has earned $12.23 per share in the last twelve months and has a current book value per share of $75.28. The Graham Number is calculated to be $143.93, suggesting that CVX is undervalued by 16.6%.
Average High Dividend Yield:
Chevron's average high dividend yield for the past 5 years is 3.88% and for the past 10 years is 3.79%. This gives target prices of $103.16 and $105.55 respectively based on the current annual dividend of $4.00. I don't expect to see yields near 3.80% until the next downturn in the economy or drop in oil prices, 3.5-3.6% seems more realistic in normal conditions. Just to be conservative though, we'll use the average of the 5 and 10 year targets giving a target yield of 3.83% and a target price of $104.36. Based on the average high dividend yield, Chevron is trading at a 15.0% premium.
Average Low PE Ratio:
Chevron's average low PE ratio for the past 5 years was 8.36 and for the past 10 years was 7.59. This corresponds to a price per share of $95.74 and $86.88 respectively based off the analyst estimate of $11.45 per share for fiscal year 2013. Both PE ratios are relatively close so I'll use the average of the two for my target entry price. Since the fiscal year is over and we're just waiting on Q4 results, I'll use the 2014 earnings estimate of $11.88 in my fair value calculation. The target prices are now $99.33 and $90.14 respectively. This corresponds to a target price of $94.74 with a 8.0 P/E ratio. Chevron is trading at a 26.7% premium, suggesting that it's overvalued.
Average Low P/S Ratio:
Chevron's average low PS ratio for the past 5 years is 0.77 and for the past 10 years is 0.68. This corresponds to a price per share of $90.93 and $80.53 respectively based off the analyst estimate for revenue growth from FY 2012 to FY 2013. Since FY 2013 is over and we're just waiting on the results from Q4, let's see what the price targets are based off the analyst estimate for FY 2014. The price targets don't include effects due to potential share buybacks, rather it's just based off the analyst estimate for revenue and growth, to be a bit conservative. The new price targets based off the estimated revenue growth of 2.10% are $92.84 and $82.22. Currently, their current PS ratio is 1.08 on a trailing twelve months basis. Once again I'll use the average of the two ratios in my target entry price calculation, giving a target price of $87.53. Chevron is currently trading for a 37.1% premium to this price.
Gordon Growth Model:
The Gordon Growth Model is a quick way to calculate the fair value of a company using the current dividend, the expected dividend growth rate, and your required rate of return or discount rate. Assuming a constant 7.00% dividend growth rate and a discount rate of 10.00%, the GGM valuation method yields a fair price of $133.33. Chevron is currently trading at a 10.0% discount to this price, suggesting that it's undervalued.
Dividend Discount Model:
For the DDM, I assumed that Chevron will be able to grow dividends for the next 5 years at the lowest of the 1, 3, 5 or 10 year growth rates or 15%. In this case that would be 9.04%. After that I assumed they can continue to raise dividends for 3 years at 75% of 9.04%, or 6.78%, and in perpetuity at 5.00%. The dividend growth rates are based off fiscal year payouts and don't necessarily correspond to quarter over quarter increases. To calculate the value I used a discount rate of 10%. Based on the DDM, Chevron is worth $93.43, meaning it's overvalued by 28.5%.
PE Ratios:
Chevron's trailing PE is 9.81 and it's forward PE is 10.10. The PE3 based on the average earnings for the last 3 years is 9.42. I like to see the PE3 be less than 15 which Chevron is currently well under. Compared to it's industry peers and Chevron is undervalued against XOM (12.9), RDS.B (11.1) and overvalued versus BP (6.3). All comparisons are on a TTM basis.
Fundamentals:
Chevron's gross margins for FY 2011 and FY 2012 were 40.9% and 41.8% respectively. They have averaged a 33.5% gross profit margin over the last 10 years. Their net income margin for the same years were 10.6% and 10.8%. Since 2003 their net income margin has averaged 8.4%. I typically like to see gross margins greater than 60% and at least higher than 40% with net income margins being 10% and at least 7%. Chevron isn't at the lofty 60% gross margin level, but they've been improving margins and are above the 40% mark. Chevron has been improving their net income margin over the last 10 years as well and have been over 10% for the last 2 fiscal years and are looking to be so for FY 2013 as well. Since each industry is different and allows for different margins, I feel it's prudent to compare Chevron to its industry. On a TTM basis CVX is doing better than XOM, BP, and RDS-B on the net income front which is good news for investors in Chevron as it means that their operations run smoother and they can reinvest higher amounts of capital into growing both the company and their dividend.
Share Buyback:
I was kind of surprised to see Chevron's shares outstanding history. The overall trend is still down but it's a lot jumpier than I would have expected. Granted it's a very capital intensive business so when times get rough you have to raise capital through either debt or by issuing shares. Over the last 10 years, Chevron has decreased the share count by a total of 8.3% for an average annual decrease of 0.86%. Share buyback programs have to be monitored much more closely than the dividend because companies are notorious for buying back shares while they're expensive and issuing shares to raise capital when they are cheap. That's not the best use of the owner's funds.

A negative number for the % change value means shares were bought back by the company and a positive value means the shares outstanding increased.
Dividend Analysis:
Chevron is a dividend champion with 26 consecutive years of dividend increases. They have increased the dividend at a 11.1%, 11.2%, 9.0%, and 10.6% rates over the last 1, 3, 5, and 10 year periods respectively. Dividend increases are based off fiscal year payouts and don't necessarily correspond to annual payouts. The consistency among the growth rates is what's truly great to see. It's a far cry from some companies that will have a 6% raise, 3% raise then a 20% raise. You might get to the same end point, but the consistency and reliability is great for a core holding. Given the expected struggles in revenue and earnings per share growth over the next year I wouldn't be surprised to see a more mellow increase in the 6-8% range. Their payout ratio based off EPS has averaged 29.6% over the last 10 years and been very consistent with a high of 50.8% in 2009 and a low of 21.7% in 2008.


Chevron's cash flow has consistently increased across the board with just two negative years. Considering how much of the operations are not under their control, the price of oil, that's another reason that Chevron has been a model of consistency.. Over the last 10 years they've been able to turn approximately 36.9% of their operating cash flow into free cash flow and 16.9% of their operating cash flow into free cash flow after paying the dividend. Their free cash flow has increased from $6.69B in 2003 to $7.87B in 2012 for an average annual increase of 1.83%. Their free cash flow after dividends has increased as well from -$0.65B to $0.99B over the same time. The free cash flow payout ratio has averaged 49.6% over the last 10 years. The concern with the oil majors is that cash flow can become strained at exactly the wrong time as it's a very capital intensive business. Capex as a percent of operating cash flow has increased from the mid to low 40%'s from 2003-2005 up to the 60-80% range in more recent years. The high variance in cash flow and capital requirements makes it all the more important for Chevron to maintain a manageable debt level.

Return on Equity and Return on Capital Invested:
Chevron's ROE has averaged a solid 21.9% over the last 10 years while their ROCI has averaged 19.4%. Their ROE has been fairly consistent too ranging from a high of 29.5% to a low of 11.4%. ROCI has ranged from 25.9% to 10.3%. The trend for both ROE and ROCI has been relatively flat, but it's been a bumpy ride along the way. One big positive is that current long-term debt is still around the levels seen in the early part of the 2000's. This has led to a decline in their debt-to-equity level from 0.34 to 0.09 from FY 2003 to FY 2012 and a corresponding decline in their debt-to-capitalization ratios from 22.7% to only 8.1%.


Revenue and Net Income:
Since the basis of dividend growth is revenue and net income growth, we'll now look at how Chevron has done on that front. Their revenue growth since the end of FY 2002 has been excellent with a 10.2% annual increase growing their revenue from $91.7B to $241.9 in FY 2012. Their net income growth has outpaced revenue growth with a 36.9% annual growth rate increasing net income from $1.1B to $26.2B. This has led to the net profit margin increasing from 1.2% in FY 2002 up to 10.8% in FY 2012. However, revenue growth is expected to struggle over the next year.

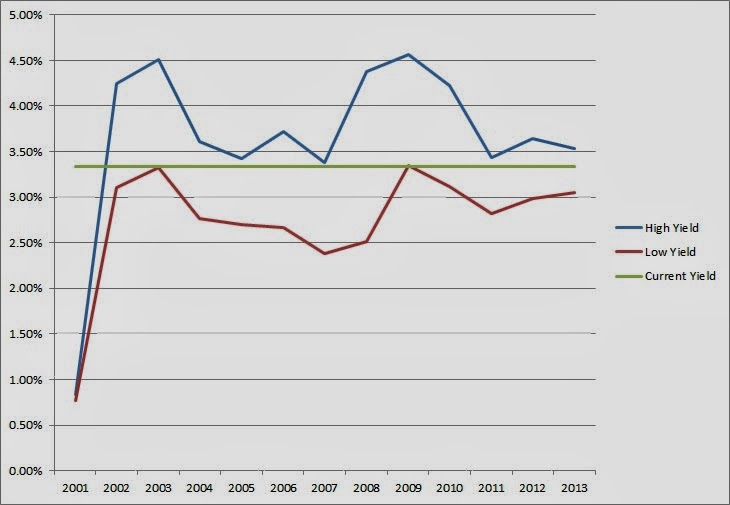
Forecast:

The chart shows the historical high and low prices since 2001 and the forecast based on the average PE ratios and the expected EPS values. I have also included a forecast based off a PE ratio that is only 75% of the average low PE ratio. I like to the look to buy at the 75% Low PE price or lower to provide for a larger margin of safety, although this price doesn't usually come around very often. In the case of Chevron, the target low PE is 7.97 and the 0.75 * PE is 5.98. This corresponds to an entry price of $94.74 based off the expected earnings for FY 2014 of $11.88, with a 75% target price of $71.05. Currently Chevron is trading at a $48.97 premium to the 75% low PE target price and a $25.28 premium to the low PE price. If you look at the chart you'll notice that the current price line intersects the average forward PE line between 2015 and 2016. This means that assuming the growth pans out the way I've forecast and that the typical PE ranges are maintained going forward you're paying for approximately 2 years of growth at current price levels.
Conclusion:
The average of all the valuation models gives a target entry price of $116.81 which means that Chevron is currently trading at a 2.8% premium to the target entry price. I've also calculated it with the highest and lowest valuation methods thrown out. In this case, the DCF and average low P/S valuations are removed and the new average is $113.96. Chevron is trading at a 5.3% premium to this price as well.
Assuming that Chevron can grow their earnings and dividends at the rates that I assumed, you're looking at okay returns over the next 10 years at current prices. In 2023, EPS would be $18.43 and slapping an average PE of 9.15 gives a price of $168.75. Over the next 10 years you'd also receive $63.41 per share in dividends for a total return of 93.4% which is good for a 6.8% annualized rate if you purchase at the current price. If you purchase at the target entry price of $113.96, your projected 10 year total return increases to 103.7% for an annualized return of 7.4%.
According to Yahoo! Finance the 1 year target estimate is at $132.39 suggesting that the share price has about 10.3% upside. Morningstar's fair value estimate is at $130.00 suggesting about 8.3% upside and has it rated as a 4 our of 5 star stock meaning it's under their fair value estimate.

There's a lot to like about Chevron and the rest of the oil majors. For all the talk of renewable energy sources and how they're going to replace "Big Oil", that day hasn't come yet. When it comes to energy production oil and natural gas products offer some of the best bang for the buck. This bodes well for the future as over the long-term the price of oil should continue to go up. That doesn't mean it won't be a bumpy ride as most commodity businesses can go through big changes in their operations depending on the price of the underlying commodity. Chevron's no different here.
Being an oil producer, Chevron doesn't have the pricing power that say a company like Apple can command for it's end products. There's differences in the quality of each barrel of oil that's produced, but for the most part it's not a concern for their operations as the price is largely out of their hands. Chevron's moat lies in their knowledge and expertise of drilling wells and getting the most production that they can out of each and every well that's drilled. Another function of their moat is that due to their size they can enter into other partnerships and have the means to drill in areas that most E&P companies couldn't even dream of getting into. They also have the technological advantage to be able to forecast other possible fields to drill in ahead of time and become a first mover into new acreage. EOG Resources was one of the first movers into the valuable Eagleford shale in South Texas and they were able to scoop up a lot of prime acreage on the cheap.
The biggest negative to investing in the "Big Oil" companies, or any oil company for that matter, is that there's always the chance that there could be some spill or other catastrophe in the future like BP's oil spill in the Gulf of Mexico or Exxon's "Valdez" running a-ground. I've never worked for Chevron or on off-shore projects, but there has been an increase in the emphasis on safety for both workers and the environment in the 3.5 years that I've been working on the exploration side of this business. Another negative is that it's a very capital intensive business. A well's total cost to drill can easily run into the $1.5-2 million range on-shore in the Eagleford which is a fairly easy formation to drill. And drilling off-shore is easily much more expensive than you standard on-shore well. The oil E&P business is difficult as by nature of the business you have a depleting asset that requires large capital expenses just to maintain your oil/gas levels, let alone expand them. As such, Chevron has spent over $116B in capital expenditures over the last 5 years.
Overall I feel that Chevron offers pretty good value at current levels given the current state of the market as a whole. Chevron is trading at a discount to its' peers and on a relative historical basis to itself. Shares of Chevron are currently offering around a 3.3% yield and they should be announcing an increase in April for their June payment. 2014 could be a tough year for Chevron but over the long-run Chevron should continue to reward its' owners with higher dividends in the 6-11% range and continue growth in their earnings per share.
To check out more reports check out my Stock Analysis page.
What do you think about Chevron as a DG investment? How do you think the long-term dividend growth prospects are?
Company Background (sourced from Yahoo! Finance):
Chevron Corporation, through its subsidiaries, engages in petroleum, chemicals, mining, power generation, and energy operations worldwide. The company operates in two segments, Upstream and Downstream. The Upstream segment is involved in the exploration, development, and production of crude oil and natural gas; liquefaction, transportation, and regasification associated with liquefied natural gas; transportation of crude oil through pipelines; and processing, transportation, storage, and marketing of natural gas, as well as holds interest in a gas-to-liquids project. The Downstream segment engages in refining crude oil into petroleum products; marketing crude oil and refined products; transporting crude oil and refined products through pipeline, marine vessel, motor equipment, and rail car; and manufacturing and marketing commodity petrochemicals and fuel and lubricant additives, as well as plastics for industrial uses. The company is also involved in coal and molybdenum mining operations; cash management and debt financing activities; insurance operations; real estate activities; and energy services, and alternative fuels and technology businesses, as well as manages interests in 11 power assets with a total operating capacity of approximately 2,200 megawatts. The company was formerly known as ChevronTexaco Corporation and changed its name to Chevron Corporation in 2005. Chevron Corporation was founded in 1879 and is headquartered in San Ramon, California.
DCF Valuation:
Analysts expect Chevron to grow earnings 6.87% per year for the next five years and I've assumed they can grow at 2/3 of that, or 4.58%, for the next 3 years and continue to grow at 4.00% per year thereafter. Running these numbers through a three stage DCF analysis with a 12% discount rate yields a fair value price of $160.36. This means the shares are trading at a 25.2% discount to the discounted cash flow analysis.
Graham Number:
The Graham Number valuation method was conceived of by Benjamin Graham, the father of value investing, and calculates the maximum price one should pay for a company given the earnings and book value. Chevron has earned $12.23 per share in the last twelve months and has a current book value per share of $75.28. The Graham Number is calculated to be $143.93, suggesting that CVX is undervalued by 16.6%.
Average High Dividend Yield:
Chevron's average high dividend yield for the past 5 years is 3.88% and for the past 10 years is 3.79%. This gives target prices of $103.16 and $105.55 respectively based on the current annual dividend of $4.00. I don't expect to see yields near 3.80% until the next downturn in the economy or drop in oil prices, 3.5-3.6% seems more realistic in normal conditions. Just to be conservative though, we'll use the average of the 5 and 10 year targets giving a target yield of 3.83% and a target price of $104.36. Based on the average high dividend yield, Chevron is trading at a 15.0% premium.
Chevron's average low PE ratio for the past 5 years was 8.36 and for the past 10 years was 7.59. This corresponds to a price per share of $95.74 and $86.88 respectively based off the analyst estimate of $11.45 per share for fiscal year 2013. Both PE ratios are relatively close so I'll use the average of the two for my target entry price. Since the fiscal year is over and we're just waiting on Q4 results, I'll use the 2014 earnings estimate of $11.88 in my fair value calculation. The target prices are now $99.33 and $90.14 respectively. This corresponds to a target price of $94.74 with a 8.0 P/E ratio. Chevron is trading at a 26.7% premium, suggesting that it's overvalued.
Average Low P/S Ratio:
Chevron's average low PS ratio for the past 5 years is 0.77 and for the past 10 years is 0.68. This corresponds to a price per share of $90.93 and $80.53 respectively based off the analyst estimate for revenue growth from FY 2012 to FY 2013. Since FY 2013 is over and we're just waiting on the results from Q4, let's see what the price targets are based off the analyst estimate for FY 2014. The price targets don't include effects due to potential share buybacks, rather it's just based off the analyst estimate for revenue and growth, to be a bit conservative. The new price targets based off the estimated revenue growth of 2.10% are $92.84 and $82.22. Currently, their current PS ratio is 1.08 on a trailing twelve months basis. Once again I'll use the average of the two ratios in my target entry price calculation, giving a target price of $87.53. Chevron is currently trading for a 37.1% premium to this price.
Gordon Growth Model:
The Gordon Growth Model is a quick way to calculate the fair value of a company using the current dividend, the expected dividend growth rate, and your required rate of return or discount rate. Assuming a constant 7.00% dividend growth rate and a discount rate of 10.00%, the GGM valuation method yields a fair price of $133.33. Chevron is currently trading at a 10.0% discount to this price, suggesting that it's undervalued.
Dividend Discount Model:
For the DDM, I assumed that Chevron will be able to grow dividends for the next 5 years at the lowest of the 1, 3, 5 or 10 year growth rates or 15%. In this case that would be 9.04%. After that I assumed they can continue to raise dividends for 3 years at 75% of 9.04%, or 6.78%, and in perpetuity at 5.00%. The dividend growth rates are based off fiscal year payouts and don't necessarily correspond to quarter over quarter increases. To calculate the value I used a discount rate of 10%. Based on the DDM, Chevron is worth $93.43, meaning it's overvalued by 28.5%.
PE Ratios:
Chevron's trailing PE is 9.81 and it's forward PE is 10.10. The PE3 based on the average earnings for the last 3 years is 9.42. I like to see the PE3 be less than 15 which Chevron is currently well under. Compared to it's industry peers and Chevron is undervalued against XOM (12.9), RDS.B (11.1) and overvalued versus BP (6.3). All comparisons are on a TTM basis.
Fundamentals:
Chevron's gross margins for FY 2011 and FY 2012 were 40.9% and 41.8% respectively. They have averaged a 33.5% gross profit margin over the last 10 years. Their net income margin for the same years were 10.6% and 10.8%. Since 2003 their net income margin has averaged 8.4%. I typically like to see gross margins greater than 60% and at least higher than 40% with net income margins being 10% and at least 7%. Chevron isn't at the lofty 60% gross margin level, but they've been improving margins and are above the 40% mark. Chevron has been improving their net income margin over the last 10 years as well and have been over 10% for the last 2 fiscal years and are looking to be so for FY 2013 as well. Since each industry is different and allows for different margins, I feel it's prudent to compare Chevron to its industry. On a TTM basis CVX is doing better than XOM, BP, and RDS-B on the net income front which is good news for investors in Chevron as it means that their operations run smoother and they can reinvest higher amounts of capital into growing both the company and their dividend.
Share Buyback:
I was kind of surprised to see Chevron's shares outstanding history. The overall trend is still down but it's a lot jumpier than I would have expected. Granted it's a very capital intensive business so when times get rough you have to raise capital through either debt or by issuing shares. Over the last 10 years, Chevron has decreased the share count by a total of 8.3% for an average annual decrease of 0.86%. Share buyback programs have to be monitored much more closely than the dividend because companies are notorious for buying back shares while they're expensive and issuing shares to raise capital when they are cheap. That's not the best use of the owner's funds.
A negative number for the % change value means shares were bought back by the company and a positive value means the shares outstanding increased.
Dividend Analysis:
Chevron is a dividend champion with 26 consecutive years of dividend increases. They have increased the dividend at a 11.1%, 11.2%, 9.0%, and 10.6% rates over the last 1, 3, 5, and 10 year periods respectively. Dividend increases are based off fiscal year payouts and don't necessarily correspond to annual payouts. The consistency among the growth rates is what's truly great to see. It's a far cry from some companies that will have a 6% raise, 3% raise then a 20% raise. You might get to the same end point, but the consistency and reliability is great for a core holding. Given the expected struggles in revenue and earnings per share growth over the next year I wouldn't be surprised to see a more mellow increase in the 6-8% range. Their payout ratio based off EPS has averaged 29.6% over the last 10 years and been very consistent with a high of 50.8% in 2009 and a low of 21.7% in 2008.
Chevron's cash flow has consistently increased across the board with just two negative years. Considering how much of the operations are not under their control, the price of oil, that's another reason that Chevron has been a model of consistency.. Over the last 10 years they've been able to turn approximately 36.9% of their operating cash flow into free cash flow and 16.9% of their operating cash flow into free cash flow after paying the dividend. Their free cash flow has increased from $6.69B in 2003 to $7.87B in 2012 for an average annual increase of 1.83%. Their free cash flow after dividends has increased as well from -$0.65B to $0.99B over the same time. The free cash flow payout ratio has averaged 49.6% over the last 10 years. The concern with the oil majors is that cash flow can become strained at exactly the wrong time as it's a very capital intensive business. Capex as a percent of operating cash flow has increased from the mid to low 40%'s from 2003-2005 up to the 60-80% range in more recent years. The high variance in cash flow and capital requirements makes it all the more important for Chevron to maintain a manageable debt level.
Return on Equity and Return on Capital Invested:
Chevron's ROE has averaged a solid 21.9% over the last 10 years while their ROCI has averaged 19.4%. Their ROE has been fairly consistent too ranging from a high of 29.5% to a low of 11.4%. ROCI has ranged from 25.9% to 10.3%. The trend for both ROE and ROCI has been relatively flat, but it's been a bumpy ride along the way. One big positive is that current long-term debt is still around the levels seen in the early part of the 2000's. This has led to a decline in their debt-to-equity level from 0.34 to 0.09 from FY 2003 to FY 2012 and a corresponding decline in their debt-to-capitalization ratios from 22.7% to only 8.1%.
Revenue and Net Income:
Since the basis of dividend growth is revenue and net income growth, we'll now look at how Chevron has done on that front. Their revenue growth since the end of FY 2002 has been excellent with a 10.2% annual increase growing their revenue from $91.7B to $241.9 in FY 2012. Their net income growth has outpaced revenue growth with a 36.9% annual growth rate increasing net income from $1.1B to $26.2B. This has led to the net profit margin increasing from 1.2% in FY 2002 up to 10.8% in FY 2012. However, revenue growth is expected to struggle over the next year.
Forecast:
Conclusion:
The average of all the valuation models gives a target entry price of $116.81 which means that Chevron is currently trading at a 2.8% premium to the target entry price. I've also calculated it with the highest and lowest valuation methods thrown out. In this case, the DCF and average low P/S valuations are removed and the new average is $113.96. Chevron is trading at a 5.3% premium to this price as well.
Assuming that Chevron can grow their earnings and dividends at the rates that I assumed, you're looking at okay returns over the next 10 years at current prices. In 2023, EPS would be $18.43 and slapping an average PE of 9.15 gives a price of $168.75. Over the next 10 years you'd also receive $63.41 per share in dividends for a total return of 93.4% which is good for a 6.8% annualized rate if you purchase at the current price. If you purchase at the target entry price of $113.96, your projected 10 year total return increases to 103.7% for an annualized return of 7.4%.
According to Yahoo! Finance the 1 year target estimate is at $132.39 suggesting that the share price has about 10.3% upside. Morningstar's fair value estimate is at $130.00 suggesting about 8.3% upside and has it rated as a 4 our of 5 star stock meaning it's under their fair value estimate.
There's a lot to like about Chevron and the rest of the oil majors. For all the talk of renewable energy sources and how they're going to replace "Big Oil", that day hasn't come yet. When it comes to energy production oil and natural gas products offer some of the best bang for the buck. This bodes well for the future as over the long-term the price of oil should continue to go up. That doesn't mean it won't be a bumpy ride as most commodity businesses can go through big changes in their operations depending on the price of the underlying commodity. Chevron's no different here.
Being an oil producer, Chevron doesn't have the pricing power that say a company like Apple can command for it's end products. There's differences in the quality of each barrel of oil that's produced, but for the most part it's not a concern for their operations as the price is largely out of their hands. Chevron's moat lies in their knowledge and expertise of drilling wells and getting the most production that they can out of each and every well that's drilled. Another function of their moat is that due to their size they can enter into other partnerships and have the means to drill in areas that most E&P companies couldn't even dream of getting into. They also have the technological advantage to be able to forecast other possible fields to drill in ahead of time and become a first mover into new acreage. EOG Resources was one of the first movers into the valuable Eagleford shale in South Texas and they were able to scoop up a lot of prime acreage on the cheap.
The biggest negative to investing in the "Big Oil" companies, or any oil company for that matter, is that there's always the chance that there could be some spill or other catastrophe in the future like BP's oil spill in the Gulf of Mexico or Exxon's "Valdez" running a-ground. I've never worked for Chevron or on off-shore projects, but there has been an increase in the emphasis on safety for both workers and the environment in the 3.5 years that I've been working on the exploration side of this business. Another negative is that it's a very capital intensive business. A well's total cost to drill can easily run into the $1.5-2 million range on-shore in the Eagleford which is a fairly easy formation to drill. And drilling off-shore is easily much more expensive than you standard on-shore well. The oil E&P business is difficult as by nature of the business you have a depleting asset that requires large capital expenses just to maintain your oil/gas levels, let alone expand them. As such, Chevron has spent over $116B in capital expenditures over the last 5 years.
Overall I feel that Chevron offers pretty good value at current levels given the current state of the market as a whole. Chevron is trading at a discount to its' peers and on a relative historical basis to itself. Shares of Chevron are currently offering around a 3.3% yield and they should be announcing an increase in April for their June payment. 2014 could be a tough year for Chevron but over the long-run Chevron should continue to reward its' owners with higher dividends in the 6-11% range and continue growth in their earnings per share.
To check out more reports check out my Stock Analysis page.
What do you think about Chevron as a DG investment? How do you think the long-term dividend growth prospects are?
nice post! CVX is one of my top prospects at the moment but I just bought TGT so I'll have to hold off until at least next month. Here's to hoping it and my other prospects (GIS, PG, KO, SJM and JNJ) continue to show weakness :-)
ReplyDeleteDivi,
DeleteI added some TGT yesterday and some PM today (Roth). There's a lot of companies I'm interested in though. CVX is good, WMT is looking better too. I also wouldn't mind adding more to both PM and TGT. PEP KO and GIS are always great too because you know you can expect that dividend increase every year.
I wouldn't mind the markets continuing to drift down or staying flat until late February or March so I can build up some more capital to make some purchases. I'm trying to balance capital needs for DGI and a rental property so it's becoming a bit frustrating as I want to move forward on both, but doing so puts the other one behind.
Thanks for stopping by!
Nice work JC. I like Chevron, and like you think it's fairly valued. I think however that from a macro perspective the world is awash in oil now that all those domestic sources are coming online. I've owned CVX for 5 years now and have been happy with the result. I am waiting for a lower price, however to buy more.
ReplyDelete-Bryan
Bryan,
DeleteI agree about the macro trend that oil prices could be heading lower. A lot of domestic oil is coming to market which could depress prices further. My position isn't quite that robust so I'll probably add some more in the first half of this year and then wait for the oil prices to really tank like they always seem to do every few years. That's when you can really make some money.
Thanks for stopping by!
COP and CVX always come up at the top of my screens. I feel they are the best two oil majors. XOM's yield is too low and P/E is higher then the others. The three european majors (BP, TOT, RDS) have all been flat share price wise while all the U.S. majors rise.
ReplyDeletePMU,
DeleteBoth COP and CVX are always near the top of the lists. I was set to try and add to my XOM position, but then Buffett ruined those plans by announcing his large stake. At least I was thinking along the same lines as him. BP is still kind of a black sheep in the investing community but I think if you add some shares you'll be pleased 5 years down the road. I haven't looked much into TOT or RDS but if you're going to still be accumulating shares you should prefer flat or negative price action so you can buy more shares.
Thanks for stopping by!