Net Worth Update - March 2021
 |
| Net Worth Update - March 2021 |
While cash flow is more important when it comes to financial independence, it's still good to look at the balance sheet too, which is why I provide these net worth updates. Since more and more of my net worth is tied to the markets, there's a larger correlation between my net worth and the markets, but in the long run as I continue to save and invest the net worth trend should be higher even though short term fluctuations can vary wildly. As a dividend growth investor I'm not overly concerned with the short-term gyrations as long as the dividend stream remains in tact, but the markets' effect is noticeable.
During March the S&P 500 continued it's climb tacking on another 4.2% for the month. It's been an absolutely crazy march higher over the past year. Just over a year ago the markets were in free fall going limit-down just about every day as COVID and its effects were beginning to ramp up across the globe. Since then there's been enormous amounts of fiscal and monetary stimulus, vaccines have been rolled out globally. The really mindboggling thing is that the S&P 500 hit a low of 2,191.86 on March 23, 2020 and is up an unbelievable 81% since.
During March the S&P 500 continued it's climb tacking on another 4.2% for the month. It's been an absolutely crazy march higher over the past year. Just over a year ago the markets were in free fall going limit-down just about every day as COVID and its effects were beginning to ramp up across the globe. Since then there's been enormous amounts of fiscal and monetary stimulus, vaccines have been rolled out globally. The really mindboggling thing is that the S&P 500 hit a low of 2,191.86 on March 23, 2020 and is up an unbelievable 81% since.
With the majority of our net worth tied up in the markets it shouldn't be a surprise to see that our net worth climbed as well. After crossing the $1M mark for assets in February, March brought yet another milestone!
During March my net worth increased $49,558.16.
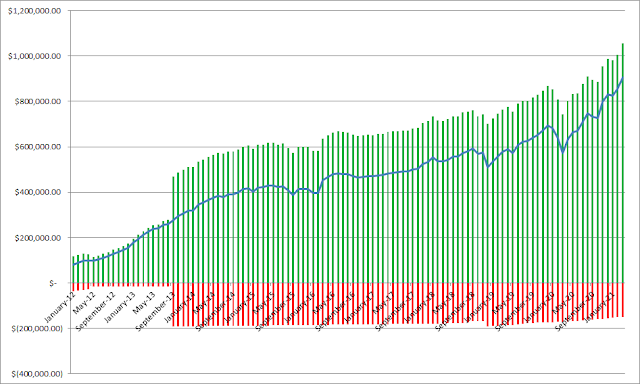
Total Assets: $1,055,173.83
Liquid Assets: $427,710.43
Total Liabilities: -$151,078.26
Net Worth: $904,095.57
We crossed into the $900k net worth in March and honestly I don't even know how it happened. Well I do, but it's just rather unbelievable especially considering that in my first net worth update for July 2010 my net worth was a -$1,663. Not bad for a little over a decade!
During March my net worth climbed 5.8% and has risen 8.7% YTD.
With our non-mortgage debt officially gone as of February we don't have much of a goal as far as the balance sheet. So it's stock pile cash for a possible down payment on some land and continue funneling savings into the brokerage account.
At this time I don't believe it makes sense to pay extra on the mortgage given our relatively low interest rate as well as the tax break on mortgage payments and think we'll come out much further ahead investing the extra cash flow. So the liabilities side of the net worth equation will be slow moving. However, once the FI portfolio is able to get to a self-sustaining level of dividends then the plan is to aggressively pay down the mortgage.
As of the end of March we have 30.9% equity in our house based on our purchase price from 2013. According to Zillow our house has increased in value around $91.8k from our purchase price which is a nice bonus, although I keep the purchase price as the value in the net worth equations. I'm not holding my breath on being able to get that kind of sale price in the market though. Based on Zillow's estimate the equity in our house jumps to 51.3%.
The following chart shows my assets and liabilities, as well as my net worth, since January 2012. While I have accurate records for my net worth dating back to July 2010, I didn't keep track of my assets and liabilities on a monthly basis until the start of 2012.
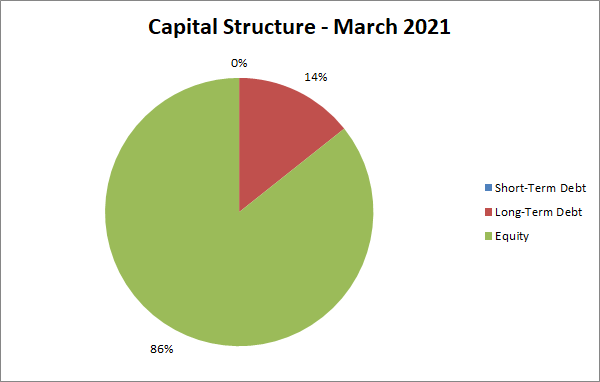
In order to give you a general idea of the breakdown of my net worth I include a % breakdown of our net worth with each monthly update. The assets are broken down into cash, taxable investments, tax advantaged investments (401k, Traditional & Roth IRAs), house (using our purchase price) and other which covers things like our cars and various collectibles from when I was a kid and deeply discounted (they don't really move the needle at all but I have them in my spreadsheet because I was bored).
Make sure you sign up to receive new posts to your email so you don't miss anything. And be sure to follow me on Twitter@JC_PIP to get up to the minute news of new purchases for my portfolio. If you prefer Pinterest or Facebook I'm on there too!
How did your net worth fare during March? Do you have any specific goals for 2021 in regards to your net worth?
Please share your thoughts below!


Comments
Post a Comment