Dividend Growth Check-Up - 2020
It was definitely one of the craziest years that I can remember since I began investing on my own. The year started off with a bang as the QQQ and SPY continued climbing higher through mid-February; however, everything broke sharply lower in late-February through mid-March. The really mind-boggling tidbit is how hard the major indexes rallied off the lows from March to finish the year up 47% for the QQQ and 16% for SPY.
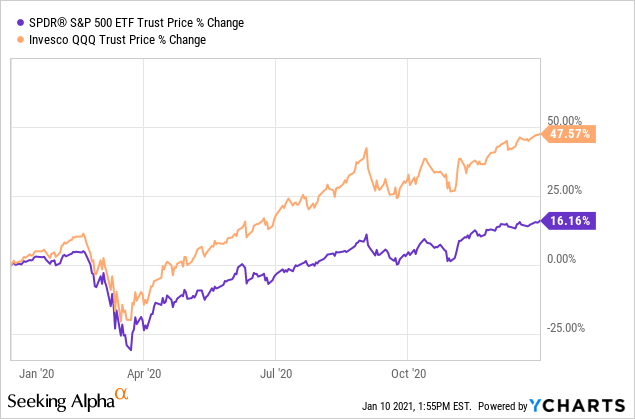 Data by YCharts
The craziness that was 2020 has finally come to an end, and while I wish I could say the craziness was behind us, I think 2020 served to reinforce the fact that we never know what is going to happen let alone how the markets will react.
While my portfolio generally held up well and I took advantage of the selloff to put some of my idle cash to work, 2020 was a trying year for my FI Portfolio where I employ a dividend growth strategy.
Forward Dividends by Sector
Last year was a difficult year for the economy as many businesses and people were forced to deal with large scale shutdowns with people sheltering in place and quarantining. My forward dividends ended 2020 at $7,564.56, a modest 2.0% increase from the end of FY 2019 despite reinvestment and new capital being deployed throughout the year. The lag was primarily due to a handful of dividend cuts that definitely stung as well as my decision to close out some positions in order to re-allocate the capital elsewhere.
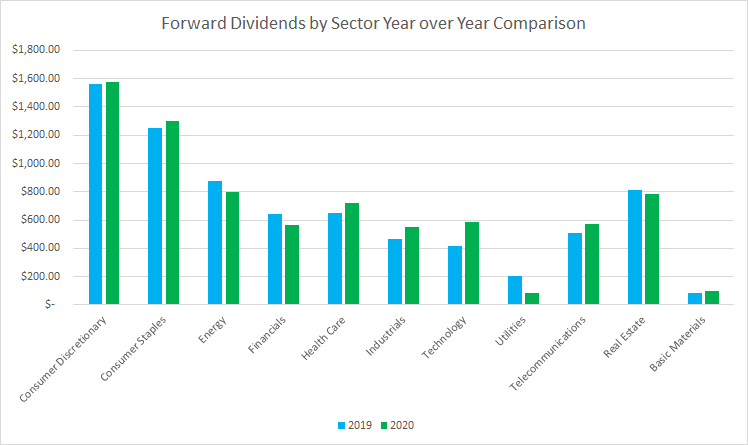
The utilities sector is one that I've largely neglected for my FI Portfolio. As such, after closing my position in Dominion Energy (D), the utilities sector showed the largest year-over-year decline falling 59%. I'm now left with just one holding, CenterPoint Energy (CNP), which is a legacy holding gifted to me from my grandfather.
The energy sector was a big drag on my forward dividends as well declining 9% compared to the end of 2019. The decrease was attributable to BP's (BP) slashing their dividend in half. I was tempted to close the position; however, the energy sector was bombed out and I just didn't think it was the right time. Probably foolish, but time will tell.
The technology sector saw the largest percentage increase from the end of 2019, rising 40%. It was also the sector with the largest dollar increase as well.
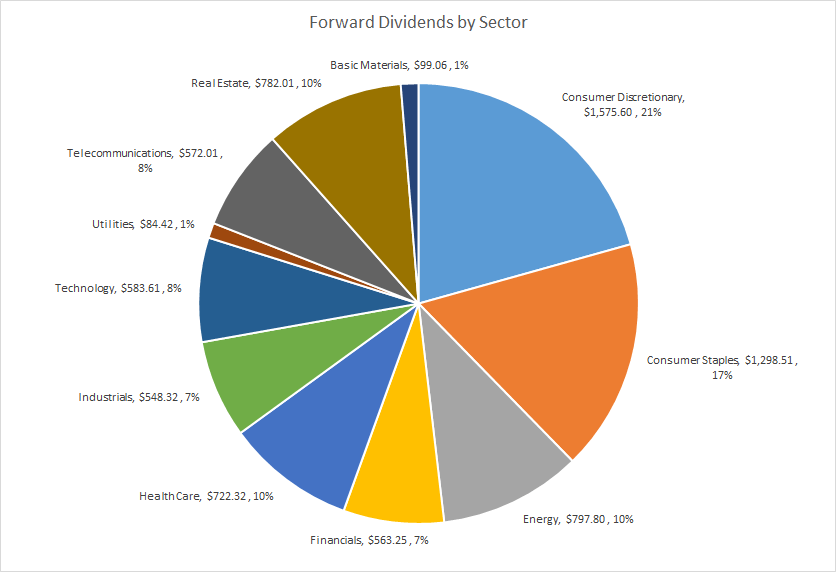
The two largest sectors by dividends remained the consumer discretionary and consumer staples. Those two account for 21% and 17%, respectively, of my forward dividends at year end 2020.
There's now a three-way tie for third place in the sector weightings between Energy, Real Estate and Health Care. Health Care improved compared to 2019 which Energy declined due to the aforementioned dividend cut and Real Estate dipped due to a few position closes.
From a big picture standpoint the sector weighting of my forward dividends aren't too out of whack from where I'd like them to be. As we move into 2021 the sectors I'd most like to increase exposure to would be Health Care, Consumer Discretionary, Consumer Staples and Technology. The only sector that I'd like to decrease my exposure to is the Energy sector which I'd like to lower to 5-8% from my previous target of roughly 8-10%.
Dividend Clubs
I like to look at my holdings by the amount of dividends that they provide so I created my "Dividend Clubs" based on varying level of "milestone" dividends. In order to join one of the Dividend Clubs the position needs to provide at least a minimum forward dividend of that club. The unique members are positions that are maxed out within the respective level.
| Club Level | # Members | # Unique Members |
| $50.00 | 39 | 9 |
| $100.00 | 30 | 13 |
| $200.00 | 17 | 11 |
| $300.00 | 6 | 5 |
| $400.00 | 1 | 1 |
The $50 Club decreased by 3 members year over year while losing 6 members that were capped out in the $50 level.
The $100 Club gained 3 members overall and 2 unique members, pushing the member count up to 30 and 13, respectively.
The $200 Club gained 1 member with the unique member count staying flat.
The $300 Club gained 1 member with Philip Morris (PM) joining the club and the solo $400 Club member is Altria (MO)
Looking ahead I expect both PepsiCo (NASDAQ:PEP) and Realty Income (O) to move up into the $300 Club ranks during 2021 through organic dividend growth alone as both are right on the precipice. The $200 Club is only likely to gain one member, IBM (IBM), during the year barring heavy allocation of capital into some of the existing $100 Club positions.
The $100 Club will likely only see one increased member in 2021 from organic dividend growth, although there's several that have the opportunity to move up depending on the opportunities presented throughout the year. The $50 Club has 2 positions, Unilever (NYSE:UL) and Becton, Dickinson & Company (BDX), that should move up a level as well.
In retrospect I wish I had been less aggressive with adding positions to my portfolio. While I like all of the businesses that I own, the problem is that many of the positions just carry no "oomph" to them in terms of dividends or invested capital. While that's good from a diversification standpoint, it does hinder the effect of the faster growing businesses.
Top 10 Holdings by Forward Dividends
My forward dividends are very much weighted towards a handful of positions. Thirteen of my holdings account for just over 50% of my forward dividends. Some of that is due to new positions in 2020 that I think increased the overall quality and growth trajectory of the dividend streams that unfortunately come with very modest current yields.

The Top 10 holdings account for 42.6% of my forward dividends as of year end 2020. That's a slight uptick from the 41.1% weighting from the end of 2019.
| Top 10 Holdings by Dividends | |
| Company | % |
| MO | 5.7% |
| JNJ | 4.7% |
| TGT | 4.6% |
| CVX | 4.5% |
| MCD | 4.1% |
| PM | 4.0% |
| PEP | 3.9% |
| O | 3.9% |
| XOM | 3.7% |
| KO | 3.5% |
| Total of Top 10 | 42.6% |
PepsiCo is the only newcomer to the Top 10 replacing BP after their dividend cut. The rest of the Top 10 remained roughly the same with some slight re-positioning due to more capital being allocated to some positions throughout the year as well as faster dividend growth from some of the holdings.
Dividend Growth
At the end of 2020, there were 64 companies that were held in my FI Portfolio which is a 10 position increase compared to the end of 2019. Some of that was somewhat out of my control as both Carrier Global (CARR) and Otis Worldwide (OTIS) were new positions after being spun off from United Technologies to facilitate the merger with Raytheon.
That also includes the decrease of 5 positions, Sabra Health Care (SBRA), General Mills (GIS), Ventas (VTR), Dominion Energy and Wells Fargo (WFC).
There were 13 new positions added to the portfolio during the year which is way more than I expected and in contrast to what my plans were going into 2020. While I didn't plan on adding that many positions and not all of them pay dividends, I do believe the future growth of the businesses and dividends are likely to be quite meaningful.
The 13 new positions are S&P Global (SPGI), Intercontinental Exchange (ICE), Broadridge Financial Solutions (BR), Constellation Software (OTCPK:CNSWF), BlackRock (BLK), Roper Technologies (ROP), Accenture (ACN) among the dividend paying cohorts as well as MercadoLibre (MELI), Amazon (AMZN), Alphabet (GOOGL) (NASDAQ:GOOG), Twilio (TWLO), Alibaba (BABA), and Sea Limited (SE) among the non-dividend payer group.
| Total Companies | 64 |
| Companies w/ Increase | 41 |
| Companies w/ No Change | 13 |
| Companies w/ Decrease | 4 |
| Companies w/ No Dividend | 6 |
With the massive hit that the economy took due to the COVID-19 pandemic, I wasn't surprised to see some dividend freezes and cuts as well as muted dividend growth.
There were still 41 holdings that announced raises during 2020 and another 13 that kept their dividends flat and didn't announce an increase during 2020.
There were a handful of the dividend freezers that were a bit surprising to me. The biggest one being AT&T (T) that did not raise their dividend during December 2020. Unilever (UL) is the other one that surprised me; however, the rest are understandable considering they were denied the opportunity in the case of Bank of America (BAC) and US Bancorp (USB), or the industry was hit especially hard for Exxon Mobil (XOM) and Phillips 66 (PSX). For all of the freezers I'm willing to give it a bit more time to see how things progress in 2021.
Moving on to the dividend cutters it was a very mixed bag. The aforementioned cut from BP wasn't too surprising, but I felt it was too late to do anything about and still maintain my position. Famous last words of a fool I suppose.
Raytheon Technologies (RTX) was a technical cut as the total dividend decreased after the completion of the spin-off of Carrier and Otis. I'm not concerned about this one at all.
CenterPoint Energy was an oddball as they increased their dividend in February, then cut it in April, then bumped it up again in December.
Ross Stores (ROST) was hit especially hard by the pandemic and the ensuing shutdowns of the economy. With an in-person consumer discretionary business, it was just an absolutely bad time to be a brick and mortar retailer. They eliminated their dividend after making the 1Q payment in March. The share price has recovered back to pre-COVID highs; however, the dividend has yet to return. This will be an interesting situation to see how things develop and Ross Stores could potentially be on the chopping block during 2021.
Dividend Yield vs Dividend Growth Rate
In my approach to dividend growth investing, I try to strike a balance between the current yield and future growth. Typically the higher the current dividend yield the lower the dividend growth and the lower the yield the higher the dividend growth.
Ideally the core of my investments would be in what I consider the "sweet spot" of dividend growth investing which is a current yield in the 2.5%-4.0% range with annual dividend growth in the 6%-10% range. As a relatively young investor I'd like to lean more towards the lower yielding, faster growing opportunities, although I do still want some of the high current yield propositions.

I've limited the range on the above chart to a 0% year over year growth rate to provide more insight to the yield versus growth mix of my FI Portfolio. Dividend growth definitely came in on the lower side of expectations; however, in general dividend growth was roughly in line with expectations.
Portfolio Wide Dividend Growth
Among my FI Portfolio holdings, the average year-over-year dividend growth rate came to 1.23% with a median increase of 2.86% which includes all positions held as of the end of 2020. When looking at just those holdings that announced increases, the average growth rate climbs to 7.46% with the median rising to 4.57%.
Those are the raw numbers; however, what I'm more interested in is the weighted dividend growth rate since I believe it paints a clearer picture of the organic dividend growth that my portfolio produced.
In order to calculate the weighted dividend growth rate, I use the 1-Year dividend growth rate for Position 1 multiplied by the Dividends for Position 1 divided by the Total Dividends for the portfolio. I then repeat that for each position and add them together to get the weighted dividend growth rate for my portfolio.
For example, consider a portfolio with two holdings with the same amount of capital invested in them. Company A pays a 5.00% yield and had year over year growth of 4.00%, while Company B pays a 1.00% yield and had year over year dividend growth of 15.00%. The average dividend growth rate works out to 9.50%; however, your dividends won't show that high of an increase since Company A currently provides a much high proportion of your future dividends. The weighted dividend growth rate for that simplified portfolio comes in at a more modest level of 5.83%.
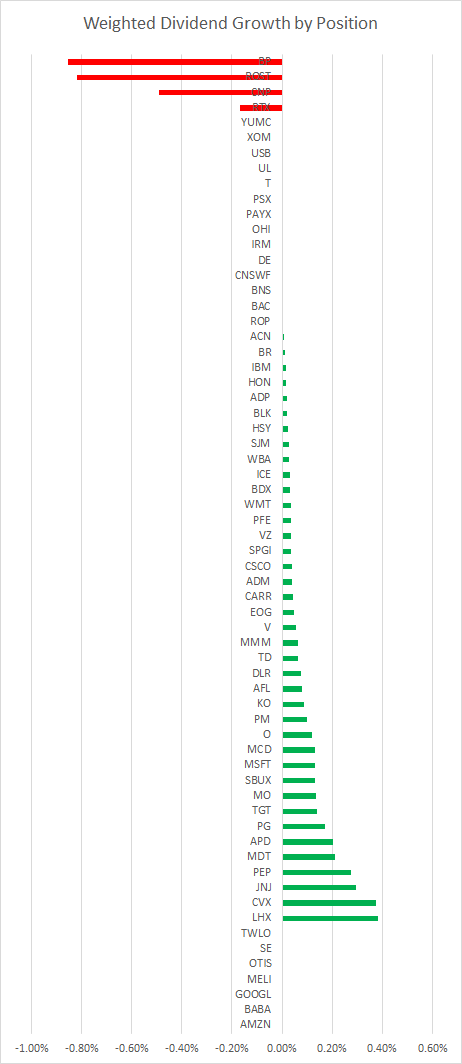
The weighted dividend growth rate for my FI Portfolio for 2020 was an uninspiring 1.44%. That isn't much a surprise to me considering how 2020 played out; however, I did have higher expectations heading into the year.
There are a few quirks with calculating it this way namely in the case of Otis Worldwide which initiated a dividend in 2020 and as such there's not a way to calculate a year over year dividend growth rate.
The other case is Ross Stores which eliminated their dividend entirely and didn't just reduce it to a lower level. In that case, their weighted dividend growth rate would be 0.00%; however, that's not a fair representation of the fact that the dividend was cut. I've adjusted it their weighted dividend growth rate to reflect their pre-cut weighting in the above chart and summation.
Focus for 2021
Overall, 2020 was a very trying year in terms of dividend growth for my FI Portfolio. While that was certainly disappointing, in the grand scheme of things I can't really complain much about 2020.
I'm pretty happy with the results for 2020 despite the abysmal dividend growth. Looking at the bigger picture my FI Portfolio generated an average of $1,900+ per quarter in extra income which was a solid $200+ increase compared to 2019's quarterly average.
I completely failed on my 2020 goal to not add new positions to my portfolio. Ideally I'd like to have fewer but larger positions compared to where we currently sit. I'm still in the process of trying to figure things out and as such it's a process that I plan to sit down and plan out moving forward.
For 2021 I'm going to continue with the goal of not increasing the number of positions that I own and instead focus on building the current ones up instead. I also plan to examine the existing positions to figure out whether all should still be in the portfolio or if it's time to sell out of some as I've done over the past few years.
How did your portfolio fare during the chaotic 2020? Was dividend growth better than you expected or relatively muted as it was in my case?
Comments
Post a Comment