Dividend Growth Checkup - 2021 #Dividend #DividendGrowth

As I like to do every time the calendar turns to a new year, it's once again time to check in my portfolio and the dividend growth that it provided. While it could have been a bit better, I can't really complain at all about how the year turned out. Especially when compared to 2020.
The bulk of my investments is in what would be classified as dividend growth stocks. The strategy appealed to me because it helps me to stay focused on the cash flow the underlying businesses provide and what I expect the future growth to potentially be. It's a strategy that I've had no issues with holding through the drawdowns as I believe the companies I own are built to last and if I'm able to buy stakes in the companies at reasonable valuations, the business quality will win out over the long term.
My knowledge base has expanded since I first began DIY investing; however, I still think I'm somewhere between level 2 and level 3 of the stages of competence. Always striving for level 4.
I've made plenty of mistakes in the past and will no doubt continue to make them in the future. That being said, 2021 was a very solid year with dividend growth rebounding sharply from 2020.
Forward Dividends by Sector
At the end of 2021, my forward dividends are well diversified by sector. I don't have a strict sector weighting plan, rather it's more of a rough guideline. I won't necessarily rebalance if the weightings get out of whack; rather I try to correct the weightings over time through additional savings and investments since I'm still in the accumulation phase.
Compared to year-end 2020, my forward dividends ended 2021 22.9% higher, which is much better than the modest 2.0% increase for the prior year.
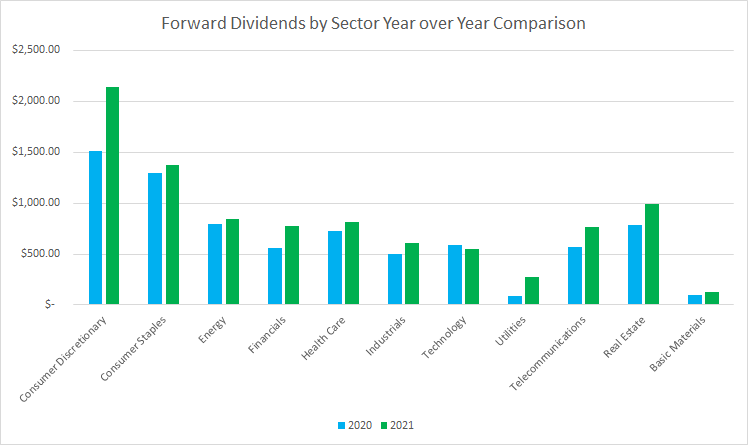
The only sector that showed a year-over-year decline was the technology sector. Every other sector saw an increase compared to year-end 2020 that ranged from 5.5% for consumer staples to 220% for utilities. On a dollar basis, the consumer discretionary sector saw the largest increase with the basic materials sector showing the smallest year-over-year increase.
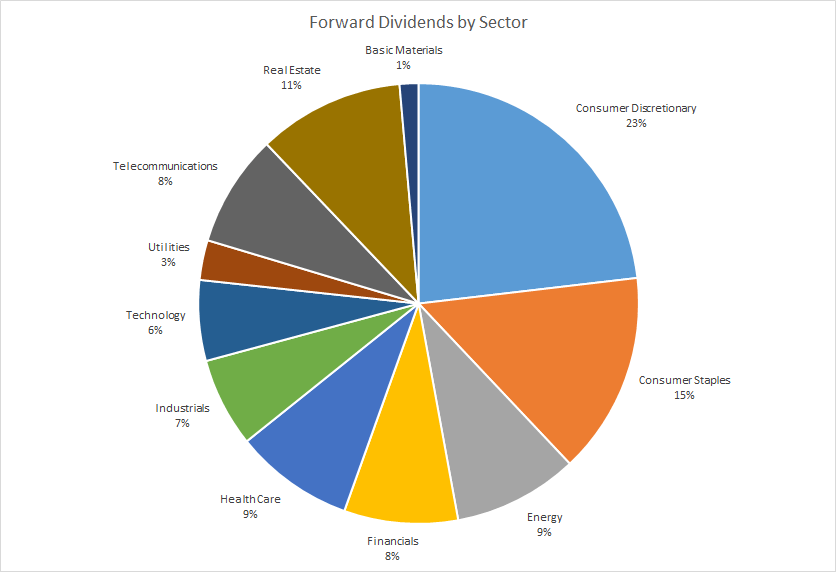
I don't place too much emphasis on sector weightings because many businesses fall into several categories, especially those in the real estate space. For example, is Realty Income (O) best classified as real estate exposure or consumer discretionary due to the large retail footprint? Or should Visa (V) be financials or technology?
Consumer discretionary is by far the leader in terms of dividends with that sector accounting for 23% of my forward dividends. Consumer staples are the next highest at 15%.
The next group has become more clustered with real estate, energy, financials, healthcare, and telecommunications, all between 8% and 11%.
For the longest time, I had ignored utilities; while that hasn't changed much, 2021 did bring about an increase to my utilities weighting. The increase in dividends was primarily due to my initiation of a position in Algonquin Power & Utilities (AQN).
Looking at the dividend sector weightings, there's not much that I'm really too concerned about. I would like consumer staples to be a big higher weighting, but nothing appears to be out of sorts.
Dividend Clubs
Each year I like to examine my holdings to see how many provide a certain amount of annual dividends. I consider each level as its own "Dividend Club" based on the milestone level of dividends. In order to join one of the Dividend Clubs, the position needs to provide at least that level of forward dividends with the unique members being those that are capped out within that level.
| Club Level | # Members | # Unique Members |
| $ 50.00 | 45 | 11 |
| $ 100.00 | 34 | 14 |
| $ 200.00 | 20 | 12 |
| $ 300.00 | 8 | 6 |
| $ 400.00 | 2 | 1 |
| $ 500.00 | 1 | 0 |
| $ 600.00 | 1 | 1 |
The $50 Club rose by 7 members compared to 2020 and now sits at 45 total members and 11 unique members.
The $100 Club increased from 30 members in 2020 up to 34 members for 2021. Although unique members only rose 1 member from 13 to 14.
The $200 Club saw an increase of 3 members compared to 2020 and now sits at 20 members with the unique members climbing 1 to 12.
The $300 Club is up to 8 total members while the $400 Club is up to 2 now. Altria (MO) finally has a dance partner in Target (TGT).
The exciting thing is that at the end of 2020, the clubs stopped at $400, but now they go all the way up to $600 with Altria being the lone member.
Looking at just dividend growth and reinvestment, I expect to gain one more $400 Club member, 1 $300 Club member, and between two to four $100 Club members during 2022.
Top 10 Holdings by Forward Dividends
My forward dividends are pretty heavily towards a handful of positions due to many of the companies I own paying out meager dividend yields or still in the early stages of having the position built out. Fourteen of my positions account for over 50% of my forward dividends at year-end 2021.
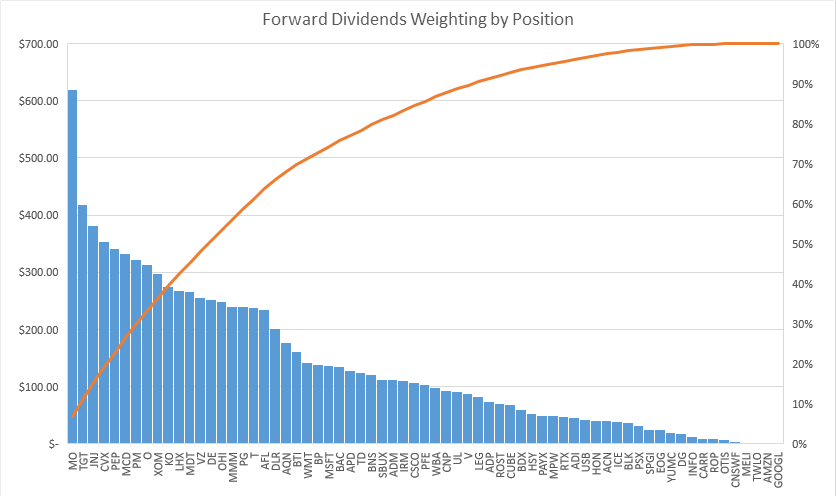
The Top 10 holdings by dividends account for 39.6% of my forward dividends at end of year 2021. That's a slight pullback from the 42.6% mark at year-end 2020 as I did a better job of building up lower-ranked positions throughout 2021.
| Top 10 Holdings by Dividends, % | ||||
| 2021 | 2020 | |||
| Company | % | Company | % | |
| MO | 6.7% | MO | 5.7% | |
| TGT | 4.5% | JNJ | 4.7% | |
| JNJ | 4.1% | TGT | 4.6% | |
| CVX | 3.8% | CVX | 4.5% | |
| PEP | 3.7% | MCD | 4.1% | |
| MCD | 3.6% | PM | 4.0% | |
| PM | 3.5% | PEP | 3.9% | |
| O | 3.4% | O | 3.9% | |
| XOM | 3.2% | XOM | 3.7% | |
| KO | 3.0% | KO | 3.5% | |
| Total | 39.6% | Total | 42.6% | |
There was no change to the constituents of the top 10; however, there was some shuffling among them. Altria was the only one that saw an increase in their percentage compared to 2020. The rest all showed an overall decline despite raises from each company during the year. Altria gained due to continued capital investment into position.
Dividend Growth
Well, I didn't quite hit my target to reduce the number of my holdings during 2021. Some of that was self-inflicted as I added new companies while closing positions in others. I was expecting the S&P Global (SPGI) acquisition of IHS Markit (INFO) to reduce the holding count by one, but the completion has been pushed back into 2022.
In total, there was a net of three companies added to the portfolio with a lot more activity behind that net gain. Companies that were initiated in 2021 were IHS Markit, Leggett & Platt (LEG), Algonquin Power & Utilities, CubeSmart (CUBE), Analog Devices (ADI), British American Tobacco (BTI), Dollar General (DG), and Medical Properties Trust (MPW).
Holdings that were closed during 2021 were Alibaba (BABA), Broadridge Financial Solutions (BR), J. M. Smucker (SJM), IBM Corporation (IBM), and Sea Limited (SE).
Of course, I also continued to add to existing positions throughout the year as well.
| Total Companies | 67 |
| Companies w/ Increase | 58 |
| Companies w/ No Change | 5 |
| Companies w/ Decrease | 0 |
| Companies w/ No Dividend | 4 |
In total, 58 of my 67 holdings announced dividend increases during the year, with 5 maintaining their dividend, and 4 companies that currently do not pay a dividend.
The freezers are the ones that I want to focus on the most. Those companies include Constellation Software (OTCPK:CNSWF), Iron Mountain (IRM), Omega Healthcare Investors (OHI), AT&T (T), and Yum China (YUMC).
AT&T has pre-announced that a cut will be coming once the WarnerMedia merger and spinoff occur with Discovery (DISCA), but for now, the dividend is intact.
Constellation Software announced they will be forgoing dividend increases to preserve more capital for Mark Leonard and his team to devote to more acquisitions. Considering their prudent capital allocation approach and results, I'm just fine with that, and if they wanted to take back the meager $1 dividend, I wouldn't complain.
Iron Mountain had previously announced that dividend raises wouldn't be coming until their leverage was reduced. My expectation is that as early as 2H 2022, a raise could be in the works.
Omega Healthcare Investors (OHI) has been in limbo the last several years as their business was hit especially hard during COVID and had stumbles in prior years. I don't expect a dividend increase from them in 2022 and they've been on the potential chopping block for several years now. For now, the dividend is still covered and being paid, but if that changes, then I'll be out.
YUM China is a bit of a surprise as their TTM free cash flow payout ratio is around 30% so there was clearly room to bump it up some. Although they've been investing heavily in increasing store counts, I do expect dividend growth will come in the future.
Dividend Yield vs Dividend Growth Rate
I aim to strike a balance between higher-yielding, but slower-growing companies with lower-yielding, but faster-growing businesses. As a relatively young investor, I have plenty of time to let dividend growth compound over the years.
Ideally, I want the bulk of my investments in what I consider the "sweet spot" which is somewhere around a 2.5% to 4.0% current yield with 5.0% to 10.0% annual dividend growth. In my opinion, that strikes a nice balance between adequate current dividend yield along with future dividend growth.
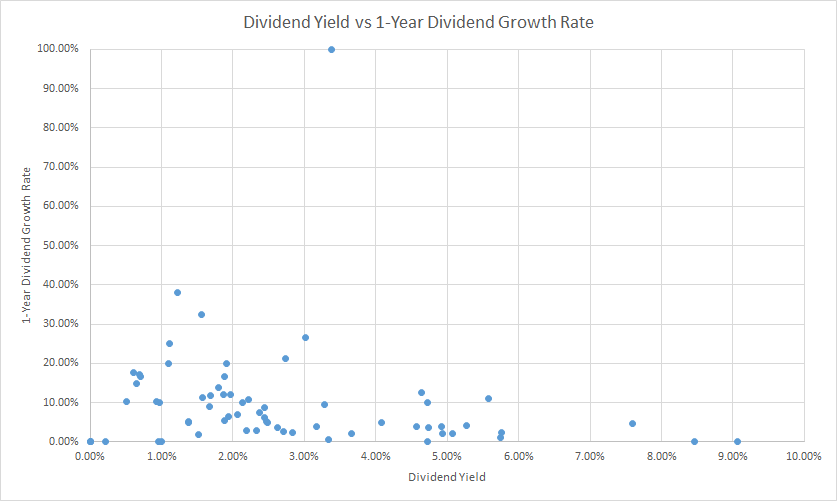
Given the rise in the stock market during 2021, share prices have generally been pushed to higher valuations and thus lower dividend yields. That's good for the short term, but I'd love to see many of these dividend yields rise.
The "sweet spot" is pretty sparse primarily due to the rise in valuations and subsequent lowering of current dividend yields. Yields are from end of year 2021 closing prices.
While the yields are overall lower at year-end 2021, dividend growth was more than adequate.
Portfolio-Wide Dividend Growth
Dividend growth saw a much-welcomed increase compared to 2020. Among my FI Portfolio holdings, the average year-over-year dividend increase when looking at all dividend-paying positions was 10.5% with an 11.4% average increase from the 58 companies that announced raises.
The median raises for those two groups were 6.7% and 8.6%, respectively. Those 5 companies that didn't announce raises really dragged down the median increase level.
In order to calculate the weighted dividend growth rate, I use the 1-year dividend growth rate for Position X multiplied by the Dividends for Position X divided by the Total Dividends for the portfolio. I then repeat that for each position that I own and add them together to get the weighted dividend growth rate for the portfolio. The reason I do this is because the weighted dividend growth rate better reflects the organic dividend growth that you achieve.
Assume that you have a portfolio with just two holdings: Company A pays a 5.0% dividend yield with a 4.0% 1-year growth rate while Company B pays a 1.0% dividend yield with a 20.0% dividend growth rate. We'll assume at the start of the year you invest $10k in each company such that your starting dividends are $600 total. At the end of the year, each company raises its dividend by the respective growth rate, and your forward dividends at the end of the year are now $645.
The average dividend growth rate between those two companies is 12.5%; however, the weighted dividend growth rate is 7.5%. The weighted dividend growth rate is dragged lower due to Company A's outsized proportion of the provided dividends.
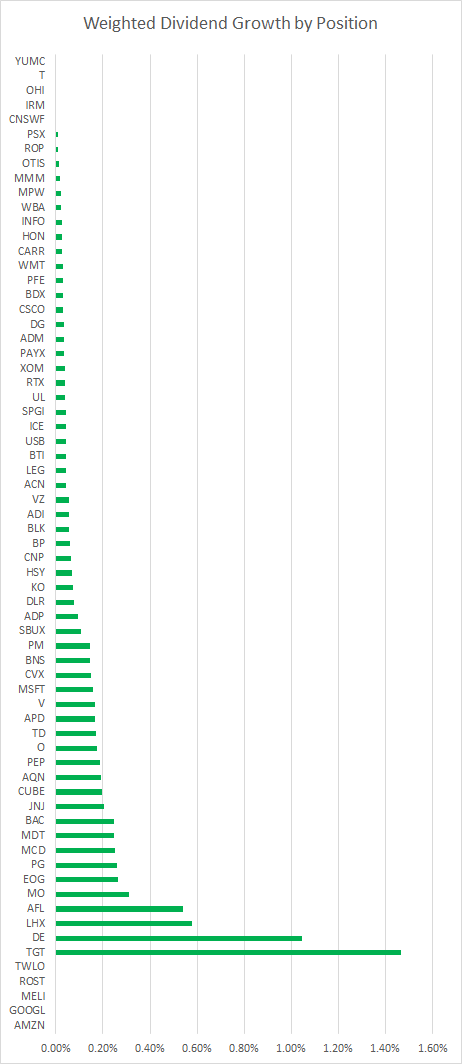
The weighted dividend growth rate for my FI Portfolio for 2021 came to 8.7%. Not bad considering that includes the 5 positions that announced no raises during the year. Even more so since those 5 positions represent 6.7% of my dividends providing no "oomph".
There are still a few quirks with this calculation as well because Ross Stores (ROST) reinstated their dividend in 2021 after cutting it after the Q1 payment in 2020. In my opinion, it wouldn't be accurate to show the monster dividend increase from $0.00 to $0.285, especially since that is also just a reinstatement to previous levels. So that's an additional 0.8% of my dividends with a total contribution of 0.00% to the weighted dividend growth.
Focus for 2022
Overall, 2021 was a solid year in terms of investing and increasing the dividends from my portfolio. Unsurprisingly, dividend growth returned after the modest increases in 2020 and I'm pretty happy with the results.
Looking at the bigger picture, my portfolio is well-diversified and if I can continue to get weighted dividend growth in the 7-9% range over the long term, I'll be more than happy. The 8.7% weighted dividend growth mark for 2021 was certainly a nice mark.
For 2021, my FI Portfolio generated just shy of $2,100 per quarter, which was also just shy of a $200 increase compared to 2020's quarterly average.
Once again, I completely failed my goal to not add new positions to my FI Portfolio with a net addition of 3 companies during the year. I do expect, rather intend, to be more strict with respect to this moving forward, and luckily 2021 saw a dramatic decrease from 2020's 13 company increase. Luckily, there should be 1 company removed during 2022 when the S&P Global and IHS Markit acquisition completes. Unfortunately, there should be a new position when AT&T and Discovery complete the spinoff/merger.
Companies that are potentially on the chopping block are 3M (MMM), Honeywell (HON), Omega Healthcare Investors (OHI), Otis Worldwide (OTIS), Carrier Global (CARR) and I'm sure I can find a few others. Otis and Carrier were both received during the Raytheon-United Technologies merger/spinoff and the positions are negligible which is the primary reason I would shed them from the portfolio.
Comments
Post a Comment