General Mills Stock Analysis
It's about time for another stock analysis. This time I decided to take a look atGeneral Mills (GIS). General Mills closed on Wednesday 5/9/12 at $38.91.
Company Background:
General Mills, Inc. manufactures and markets branded consumer foods worldwide. It also supplies branded and unbranded food products to the foodservice and commercial baking industries. The company offers ready-to-eat cereals, refrigerated yogurt, ready-to-serve soup, dry dinners, shelf stable and frozen vegetables, refrigerated and frozen dough products, dessert and baking mixes, frozen pizza and pizza snacks, grain, fruit and savory snacks; and a range of organic products, including soup, granola bars, and cereals; and ice cream and frozen desserts, and grain snacks. It sells its products through its direct sales personnel, as well as through broker and distribution arrangements to grocery stores, mass merchandisers, membership stores, natural food chains, drug, dollar and discount chains, commercial and noncommercial foodservice distributors and operators, restaurants, and convenience stores.
DCF Valuation:
Analysts expect General Mills to grow earnings 7.15% per year for the next five years and I've assumed they can continue to grow at 3.00% per year thereafter. Running these numbers through a DCF analysis with a 10% discount rate yields a fair value price of $43.43. This means that at $38.91 the shares are undervalued by 10%.
Graham Number:
Over the last 12 months, GIS's EPS were $2.34 and it's current book value per share is $10.70. The Graham Number is calculated to be $23.74 which means that at $38.91 the shares are overvalued by 64%.
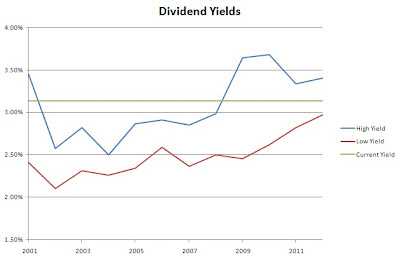
Average High Dividend Yield:
GIS's average high dividend yield for the past 5 years is 3.41% and for the past 10 years is 3.13%. This gives target prices of $35.77 and $38.96 respectively based on the current annual dividend of $1.22. These are overvalued by 9% and fairly valued, respectively.
Average Low PE Ratio:
General Mill's average low PE ratio for the past 5 years is 12.97 and for the past 10 years is 14.25. This would correspond to a price per share of $32.93 and $36.20 respectively based off the analyst estimate of $2.54 per share for the current fiscal year ending in May. The 5 year and 10 year low PE price targets are overvalued by 18% and 7%, respectively.
Dividend Discount Model:
For the DDM I assumed that GIS will be able to grow dividends for the next 5 years at the minimum of 15% or the lowest of the 1, 3, 5 or 10 year growth rates. In this case that would be 8.29%. After that I assumed GIS can continue to raise dividends by 3.00% annually and used a discount rate of 7.5%. Based on this GIS is worth $30.98 meaning it's overvalued by 25%.
PE Ratios:
GIS's trailing PE is 16.63 and it's forward PE is 14.10. The CAPE for the previous 10 years is 23.51. Compared to it's industry, GIS seems to be undervalued versus Danone (18.68) and overvalued versus Kellog's (15.04) and undervalued versus the industry as a whole (19.17). All industry and competitor comparisons are on a TTM EPS basis.
Fundamentals:
GIS's gross margin for FY 2009/10 and FY 2010/11 were 39.63% and 40.01% respectively. Their gross margin is very high at ~40% and consitent too. I like to see both of those when looking at potential dividend growth stocks since it means they have pricing power. Their net income margin for the same years were 10.46% and 12.09% respectively. I like the net income margin to be at least 10% and preferably rising. General Mills passes both of my criteria for net income margin. The cash-to-debt ratio for the same years were 0.13 and 0.11. Their cash-to-debt ratio is the only thing really lacking on the fundamentals front.
Share Buyback:
GIS's shares outstanding have been fairly steady without significant changes up or down.

A negative number for the % change value means shares were bought back by the company and a positive value means the shares outstanding increased.
Dividend Analysis:
General Mills is a dividend contender with 8 consectutive years of dividend increases. They're average increase has been fairly steady averaging for the last 1, 3, 5 and 10 years 8.93%, 12.36%, 11.12%, 8.29%. It seems that a culture of increasing dividends has been formed with upper management which is good to see. While the dividends have been increasing their annual payout ratios have been pretty consistent since 2003. Their low payout ratio has been 39.86% and the high payout ratio was 46.21% with an average of 43.20% since 2003. I would like it to be lower but the fact that the payout ratio has been steady despite increases in the dividend is a good sign.

The FCF payout ratio is a little troubling. Since 2001 they've only had 5 years with a FCF payout ratio greater than 100% and most recently in 2011 had a FCF payout ratio of 1244.44%. Monitoring their FCF and FCF payout ratio will let you know a lot more about the stability of the company since dividends are paid from cash.
Return on Equity and Return on Capital Invested:
GIS's ROE and ROCI have been trending upwards since 2002. I like to see a stable or increasing value for both. This means that management has done a better job with their investments.

Gross and Net Profit Margins:
General Mill's gross profit margin has averaged 42.48% since 2002 has hasn't seen any big changes either way. Their net profit margin, percentage of every dollar of sales they get to keep, has been ticking up slightly the last few years. Since 2002 it's averaged 9.44% and has increased to 10.30% and 12.10% for the last 2 fiscal years. A stable or increasing profit margin is good to see since it means that the company is improving it's efficiency and getting to keep more of every dollar they bring in.
Revenue and Net Income:
Since the basis of dividends growth is revenue and net income growth I've added a new section to my stock analysis. Here you can see General Mill's history of revenue and net income since 2001. GIS's net income margin has been increasing recently which is good news for continued dividend increases.

Average Price and EPS:

GIS's average share price has tracked their EPS fairly closely since 2001. This means that their PE ratio has been fairly consistent in that time period. The values are based solely off the average high and low prices for the fiscal year meaning that it doesn't truly show the value opportunities that are present throughout the time period.
Forecast:

The chart shows the historical prices for the previous 10 years and the forecast based on the average PE ratios and the expected EPS values. I have also included a forecast based off a PE ratio that is only 75% of the average low PE ratio for the previous 10 years. I like to the look to buy at the 75% Low PE price or lower to provide for additional margin of safety. Currently General Mills is trading at a $14 premium to the forecast entry price.
Conclusion:
The average of all the valuation models gives a value of $36.42 which means that General Mills is currently trading at a 7% premium to the fair value.
Overall I think that GIS is fairly valued at today's prices. I think if you can get into General Mills with a 3.50% YOC it might be tempting to take a chance on. That would mean a cost basis of $34.86. This would only give you a margin of safety of 4% based on the average of the valuations, but could still prove to be a solid entry target if the dividend growth can continue along it's recent past. I would probably look to sell puts if the premiums can give at least a 10% annual yield. That way my entry price is guaranteed and I would still earn a 10% CAGR on my cash.
Company Background:
General Mills, Inc. manufactures and markets branded consumer foods worldwide. It also supplies branded and unbranded food products to the foodservice and commercial baking industries. The company offers ready-to-eat cereals, refrigerated yogurt, ready-to-serve soup, dry dinners, shelf stable and frozen vegetables, refrigerated and frozen dough products, dessert and baking mixes, frozen pizza and pizza snacks, grain, fruit and savory snacks; and a range of organic products, including soup, granola bars, and cereals; and ice cream and frozen desserts, and grain snacks. It sells its products through its direct sales personnel, as well as through broker and distribution arrangements to grocery stores, mass merchandisers, membership stores, natural food chains, drug, dollar and discount chains, commercial and noncommercial foodservice distributors and operators, restaurants, and convenience stores.
DCF Valuation:
Analysts expect General Mills to grow earnings 7.15% per year for the next five years and I've assumed they can continue to grow at 3.00% per year thereafter. Running these numbers through a DCF analysis with a 10% discount rate yields a fair value price of $43.43. This means that at $38.91 the shares are undervalued by 10%.
Graham Number:
Over the last 12 months, GIS's EPS were $2.34 and it's current book value per share is $10.70. The Graham Number is calculated to be $23.74 which means that at $38.91 the shares are overvalued by 64%.
Average High Dividend Yield:
GIS's average high dividend yield for the past 5 years is 3.41% and for the past 10 years is 3.13%. This gives target prices of $35.77 and $38.96 respectively based on the current annual dividend of $1.22. These are overvalued by 9% and fairly valued, respectively.

Average Low PE Ratio:
General Mill's average low PE ratio for the past 5 years is 12.97 and for the past 10 years is 14.25. This would correspond to a price per share of $32.93 and $36.20 respectively based off the analyst estimate of $2.54 per share for the current fiscal year ending in May. The 5 year and 10 year low PE price targets are overvalued by 18% and 7%, respectively.
Dividend Discount Model:
For the DDM I assumed that GIS will be able to grow dividends for the next 5 years at the minimum of 15% or the lowest of the 1, 3, 5 or 10 year growth rates. In this case that would be 8.29%. After that I assumed GIS can continue to raise dividends by 3.00% annually and used a discount rate of 7.5%. Based on this GIS is worth $30.98 meaning it's overvalued by 25%.
PE Ratios:
GIS's trailing PE is 16.63 and it's forward PE is 14.10. The CAPE for the previous 10 years is 23.51. Compared to it's industry, GIS seems to be undervalued versus Danone (18.68) and overvalued versus Kellog's (15.04) and undervalued versus the industry as a whole (19.17). All industry and competitor comparisons are on a TTM EPS basis.
Fundamentals:
GIS's gross margin for FY 2009/10 and FY 2010/11 were 39.63% and 40.01% respectively. Their gross margin is very high at ~40% and consitent too. I like to see both of those when looking at potential dividend growth stocks since it means they have pricing power. Their net income margin for the same years were 10.46% and 12.09% respectively. I like the net income margin to be at least 10% and preferably rising. General Mills passes both of my criteria for net income margin. The cash-to-debt ratio for the same years were 0.13 and 0.11. Their cash-to-debt ratio is the only thing really lacking on the fundamentals front.
Share Buyback:
GIS's shares outstanding have been fairly steady without significant changes up or down.

A negative number for the % change value means shares were bought back by the company and a positive value means the shares outstanding increased.
Dividend Analysis:
General Mills is a dividend contender with 8 consectutive years of dividend increases. They're average increase has been fairly steady averaging for the last 1, 3, 5 and 10 years 8.93%, 12.36%, 11.12%, 8.29%. It seems that a culture of increasing dividends has been formed with upper management which is good to see. While the dividends have been increasing their annual payout ratios have been pretty consistent since 2003. Their low payout ratio has been 39.86% and the high payout ratio was 46.21% with an average of 43.20% since 2003. I would like it to be lower but the fact that the payout ratio has been steady despite increases in the dividend is a good sign.

The FCF payout ratio is a little troubling. Since 2001 they've only had 5 years with a FCF payout ratio greater than 100% and most recently in 2011 had a FCF payout ratio of 1244.44%. Monitoring their FCF and FCF payout ratio will let you know a lot more about the stability of the company since dividends are paid from cash.
Return on Equity and Return on Capital Invested:
GIS's ROE and ROCI have been trending upwards since 2002. I like to see a stable or increasing value for both. This means that management has done a better job with their investments.

Gross and Net Profit Margins:
General Mill's gross profit margin has averaged 42.48% since 2002 has hasn't seen any big changes either way. Their net profit margin, percentage of every dollar of sales they get to keep, has been ticking up slightly the last few years. Since 2002 it's averaged 9.44% and has increased to 10.30% and 12.10% for the last 2 fiscal years. A stable or increasing profit margin is good to see since it means that the company is improving it's efficiency and getting to keep more of every dollar they bring in.
Revenue and Net Income:
Since the basis of dividends growth is revenue and net income growth I've added a new section to my stock analysis. Here you can see General Mill's history of revenue and net income since 2001. GIS's net income margin has been increasing recently which is good news for continued dividend increases.

Average Price and EPS:

GIS's average share price has tracked their EPS fairly closely since 2001. This means that their PE ratio has been fairly consistent in that time period. The values are based solely off the average high and low prices for the fiscal year meaning that it doesn't truly show the value opportunities that are present throughout the time period.
Forecast:

The chart shows the historical prices for the previous 10 years and the forecast based on the average PE ratios and the expected EPS values. I have also included a forecast based off a PE ratio that is only 75% of the average low PE ratio for the previous 10 years. I like to the look to buy at the 75% Low PE price or lower to provide for additional margin of safety. Currently General Mills is trading at a $14 premium to the forecast entry price.
Conclusion:
The average of all the valuation models gives a value of $36.42 which means that General Mills is currently trading at a 7% premium to the fair value.
Overall I think that GIS is fairly valued at today's prices. I think if you can get into General Mills with a 3.50% YOC it might be tempting to take a chance on. That would mean a cost basis of $34.86. This would only give you a margin of safety of 4% based on the average of the valuations, but could still prove to be a solid entry target if the dividend growth can continue along it's recent past. I would probably look to sell puts if the premiums can give at least a 10% annual yield. That way my entry price is guaranteed and I would still earn a 10% CAGR on my cash.
Comments
Post a Comment